
On the Profit & Loss tab run an extremely powerful P&L analysis based on the following query criteria.
 |
Note: These reports include GST. |
Date Range
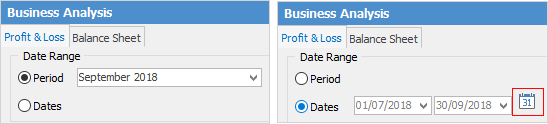
Period
or
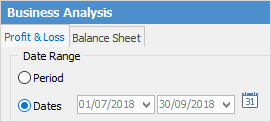
Dates
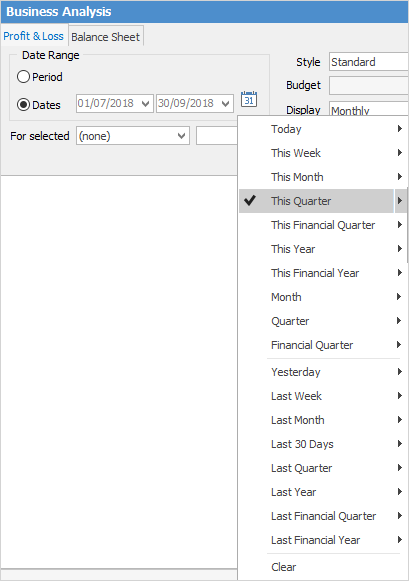
Choose either to run the P&L report views by accounting periods, or for a specific date range. Click the  to choose from predefined date ranges, such as Today, This Week, This Month, Last Year, Last Quarter, etc.
The P&L can be run just for a specific branch and sub-branch (if branches are enabled).
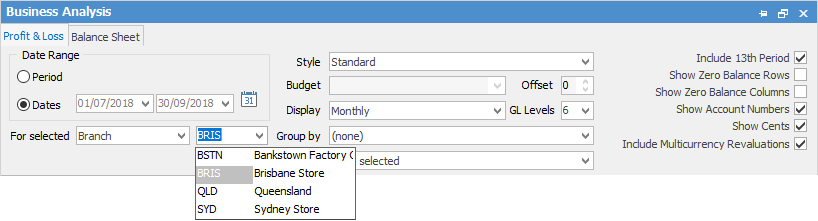
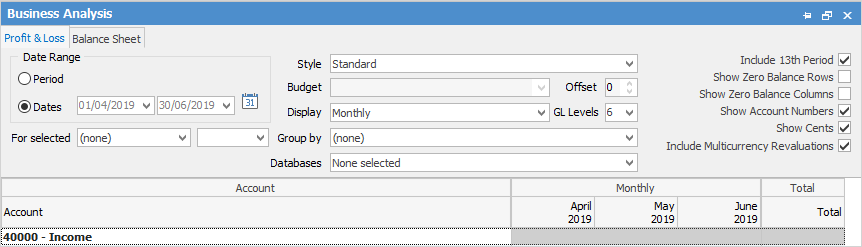
In Style pick what sort of P&L to look at:
▪Standard – monthly views.
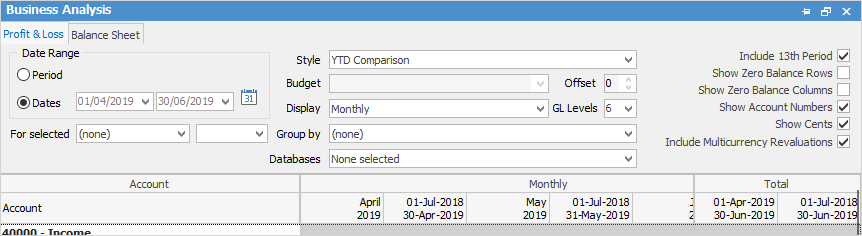
▪YTD Comparison – will provide a running total of how the business has been performing from the start of the financial year.
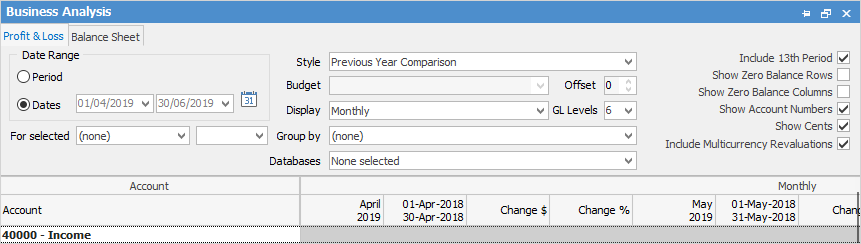
▪Previous Year Comparison – Compare performance this time last year with right now.
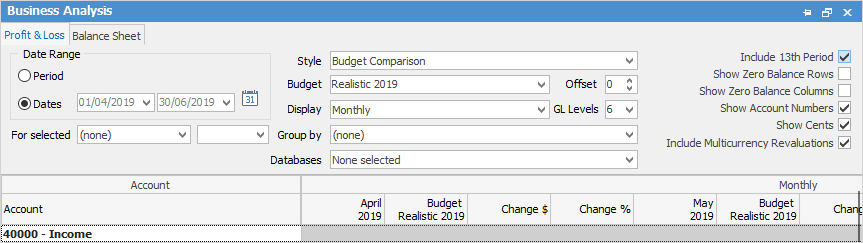
▪Budget Comparison – This will compare performance now with a designated budget. Choose a budget from the dropdown options to compare to for this to work.
▪Budget Only – Through this look at budget/projected P&L.
▪Budget and YTD Comparison – Compares budget and year to date side by side.
▪Display – Specify what time period the P&L is to be sorted by: Total Only, Daily, Yearly, Monthly, Quarterly, Yearly, Yearly (Financial).
▪Group By – If Branches or Sub-Branches are enabled, there is an option to group the P&L by them. Options are: Branch, Sub-Branch, GL Department, Database.
▪Offset – Offset comparisons by year from 9 to -9.
▪General Ledger Levels – Set how many levels down the P&L is to look at.
▪Include 13th Period – Include 13th period in the general ledger.
▪Show Account Numbers/Show Zero Balances/Show Cents – Yes/No?
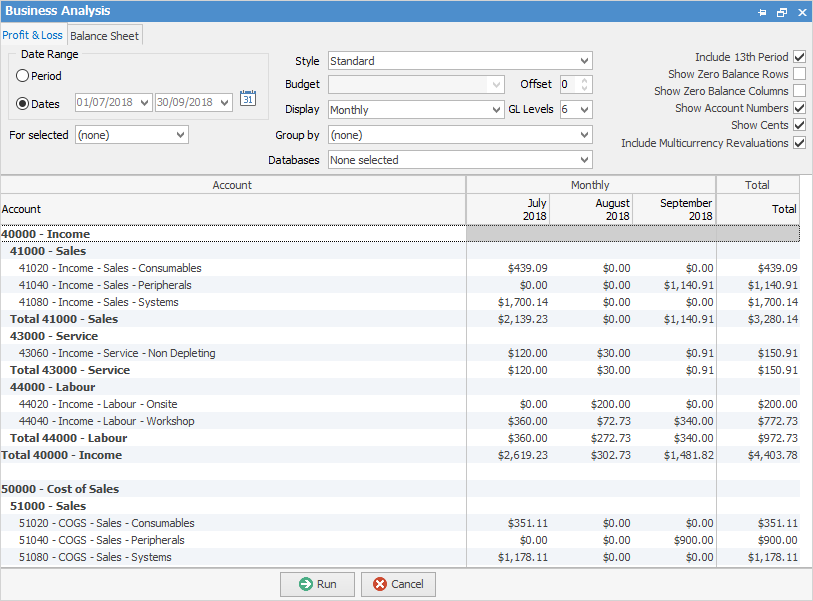
After these options have been set up, run the P&L. This is a standard P&L Report displaying monthly:
And this is a P&L using Budget Comparison showing Quarterly.
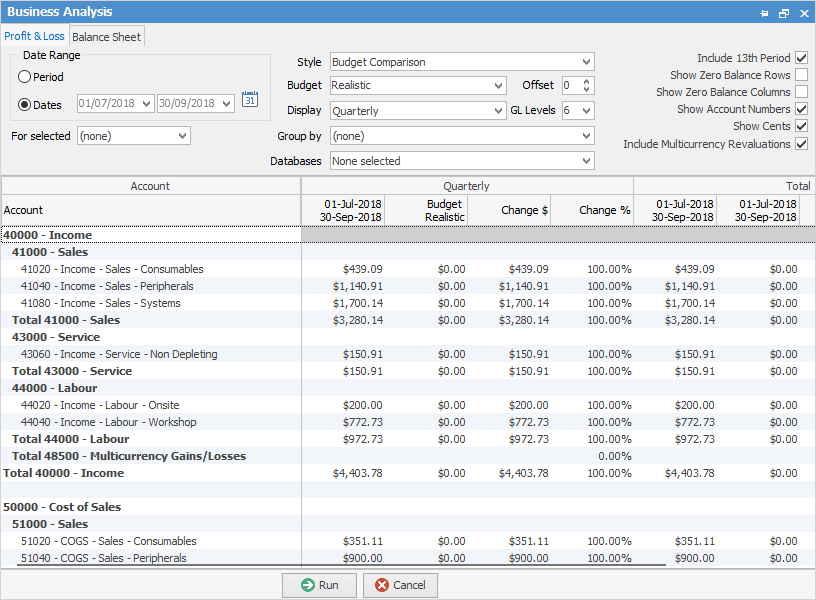
When running a budget comparison, Jim2 will display a change in $ and a change in % columns.
By right clicking on the figures select Hide the Change Columns, do a drilldown via Account inquiry or General Ledger to see what transactions make up these figures. There is also an option to Export Data to a spreadsheet, HTML, XML or text file.
Further information