If you require a stock on hand valuation report as at a prior date (ie. 30th June), there may be differences between the original report and the current report. This is due to the fact that there may be some transactions against purchase orders and jobs in the month after.
Report |
Explanation |
||||||||||||
|---|---|---|---|---|---|---|---|---|---|---|---|---|---|
Min Qty in Stock |
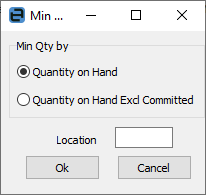
Produces a report of minimum stock quantities either on hand, or on hand excluding committed, and can be based on stock locations.
 |
||||||||||||
Stock in Advance Liability |
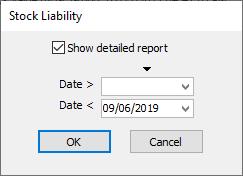
Produces a report listing stock sold in advance and stock sold from purchases on Received.
|
||||||||||||
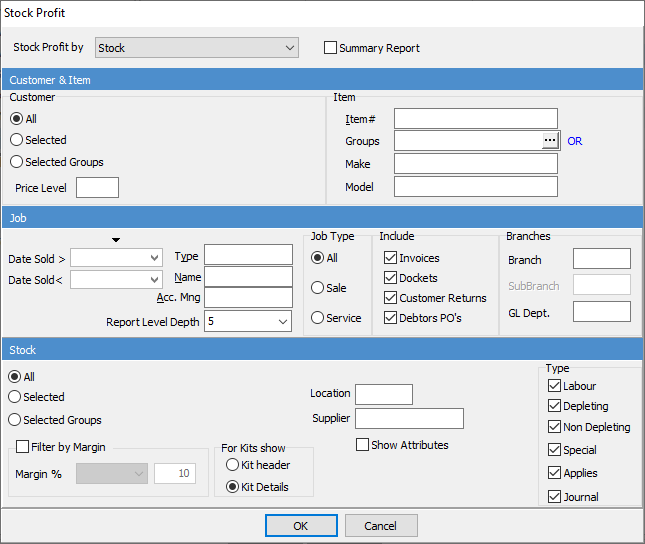
Stock Profit (Old) |
Produces a report of all stock based on the extensive choices.
 |
||||||||||||
Stock Reorder |
Produces a list of stock
|
||||||||||||
Stock Valuation by Cost Stock Valuation by COGS |
Produces comprehensive reports on stock valuation by both cost and COGS.
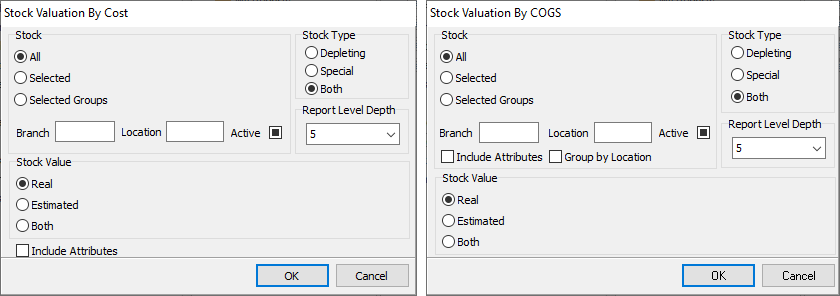
If you require a stock on hand valuation report as at a prior date (ie. 30th June), you will need to restore a backup from that date, as Jim2 is a live stock system. |
||||||||||||
Stock Valuation by GL Account |
Produces a spreadsheet detailing stock value by GL account.
The Stock Valuation by GL Account report is a diagnostic report to be run if the Stock Value by GL Group (Summary) report shows there is a value discrepancy between the GL Value and the stock sub-ledger value.
Variances typically occur in the following situations: 1.The GL Opening Balance is manually altered (it is generated from the Opening Balance PO's and should never be touched). 2.Users have journalled directly to the 1-XXXX Stock on Hand accounts (they should not do this). 3.You may see small rounding variances over time, but usually if you have a high volume of purchases and returns and are transacting in 4 decimal places and/or multicurrency.
The Stock list – Stock on Hand Report includes the below, whereas the Stock Value by GL Account Report does not: •Consignment Stock (From a Consign In PO) •Consignment Stock (From a Consign Buy PO), but only if these have not been sold. |
||||||||||||
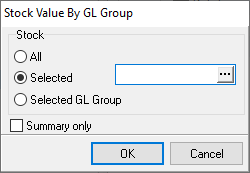
Stock Valuation by GL Group |
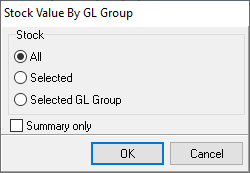
Produces a report using the following filters:
|
||||||||||||
Stock Valuation by GL Group As Of |
Produces a report of stock as above as of a certain date.
|
||||||||||||
Stock Value by Qty on Hand |
Produces a report of stock on hand by quantity and value. This can also be as of a certain date.
|
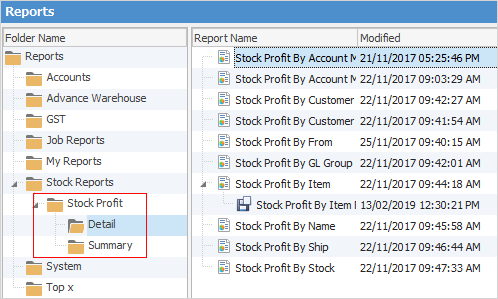
In the sub-folders within the Stock Reports folder, there are extensive stock profit reports to choose from.
There are more detailed stock profit reports under the Stock Profit sub-folder.
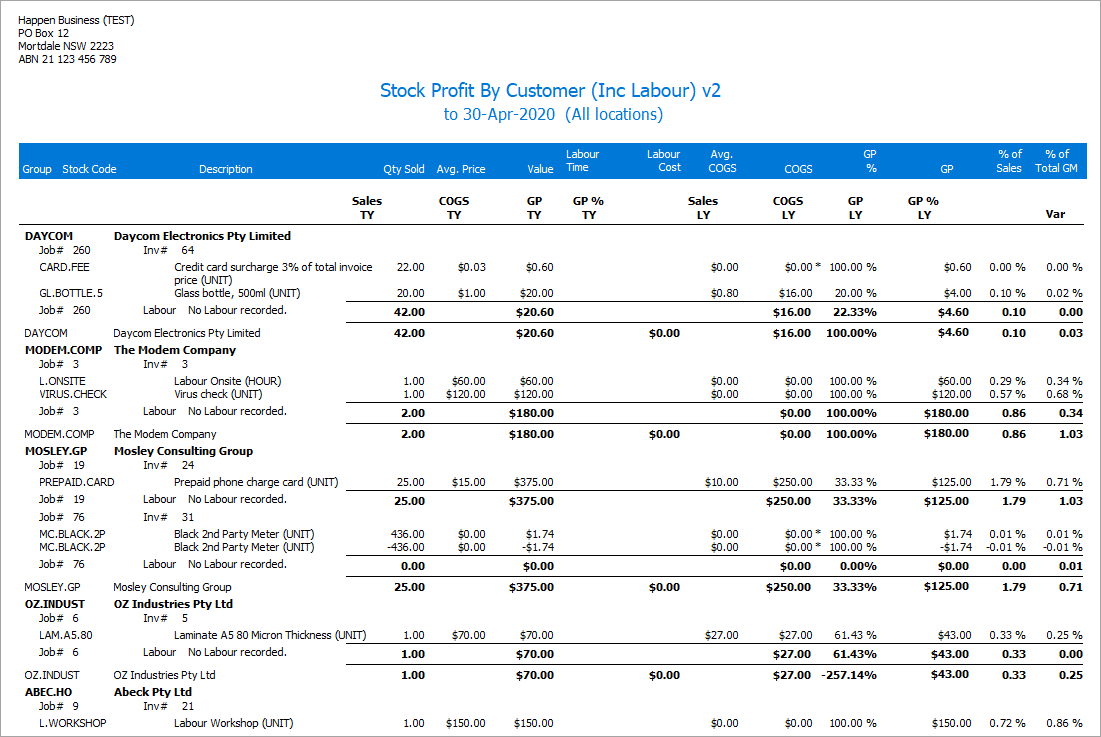
An asterisk beside a figure indicates that one or more of the entries in the report may have estimated costs. These are costs estimated by looking at the purchase orders the stock has come from. Where the purchase orders are on Received status, there is no final cost for the products, so the report will provide an estimate.
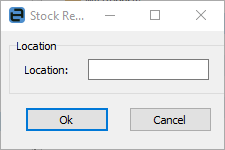
Stock Reorder will produce a report of stock required to be reordered, and can be filtered by stock location.
Stock Valuation by COGS/Cost
Three are three filters within Stock Valuation by COGS: Real, Estimated, Both.
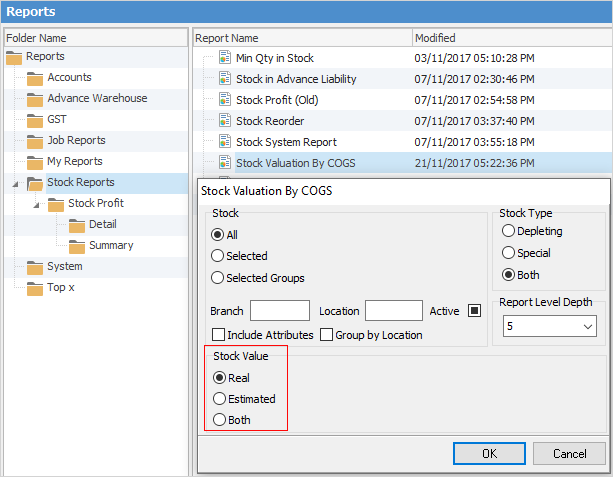
▪Select Real as the filter:
–The Stock Valuation by COGS report reflects the exact COGS (cost of goods sold) of the stock currently on hand, based on FIFO (first-in first-out). If there are 2 units on hand that were purchased on different purchase orders at different prices, the total COGS is a combination of those two different COGS.
–The Stock Valuation by Cost report reflects the exact cost of the stock currently on hand, based on FIFO. If there are 2 units on hand that were purchased on different purchase orders at different prices, the total cost is a combination of those two different purchase prices.
▪If Estimated is selected as the filter, the report will only include stock from purchase orders on Received where the cost/COGS is estimated because the purchase orders have not been finalised.
▪If Both is selected as the filter, the report will include all stock on hand from purchase orders on Finish as well as those on Received.
▪The Estimated filter in this report has nothing to do with the Estimated field on the Vendors tab of stock records.
|
Be aware that: ▪The Estimated field on the Vendors tab on stock records is not a dynamic field and has to be manually updated. ▪The Cost and COGS fields are automatically updated when purchase orders and linked expense orders are finished. |
As far as stock valuation reports are concerned:
▪Stock Valuation by COGS includes any freight component on purchase orders and any linked expenses. This report should always match the general ledger.
▪The Stock Valuation by Cost ignores any freight on purchase orders or other linked expenses and most likely will not match the general ledger.
Purchasing warranty stock at zero impacts the stock valuation. If there are 10 units on hand and nine of them were brought in at zero, the stock valuation will be at that lowered cost, ie. price of 1 ÷ 10 provides a lower unit cost.
If warranty stock is ordered for specific warranty jobs and the purchase order is linked to the job, the warranty stock will be supplied against the correct job, and the profit reporting on jobs will be accurate.
If supplying stock from the company's inventory for warranty jobs, buying replacement warranty stock at zero means the job profit reporting may be skewed as a result of this. The overall P&L result will be accurate, but the job profit reporting may not be at a job level.
Stock Valuation by GL Account will produce a spreadsheet detailing stock on hand sales general ledger figures.
Stock Valuation by GL Group will produce a report of all stock values based on GL Groups.
Stock profit reports
This area allows for being very specific about stock profit reporting. Filter the report by the following:
▪Account Manager
▪Account Manager and job
▪Customer
▪Customer (Inc Labour)
▪Customer and report level
▪By From
▪By GL Group
▪By Item
▪By Name
▪By Ship
▪By stock.
Produce either a detailed or summary report.
|
The GP% columns represent the values of sales and gross profit of each line of the report, as a percentage of the report totals.
These percentages will vary every time you filter the report in a different way. |
Further information
