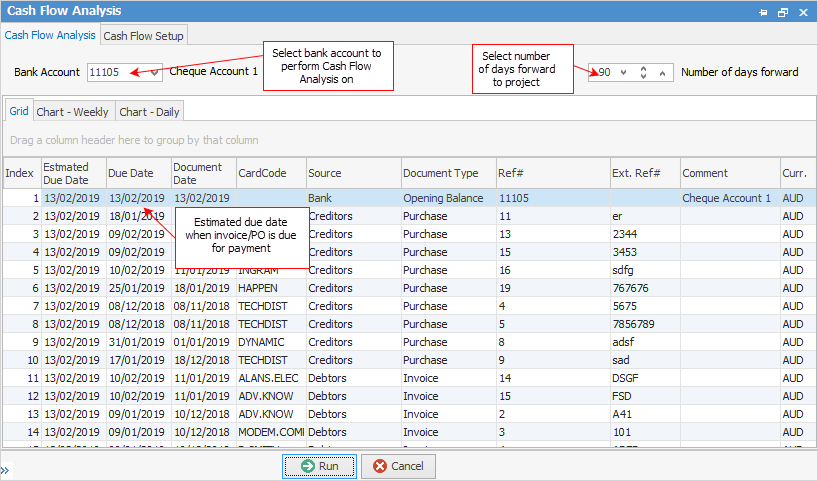
The main Cash Flow Analysis tab allows you to select the bank account on which to base the analysis, and how many days forward you wish to project. The default is 90, but you can use  to change this.
Select the bank account and number of days forward, then click Run. The generated list will display a dated running total of your bank account balance, and the inputs that affect it.

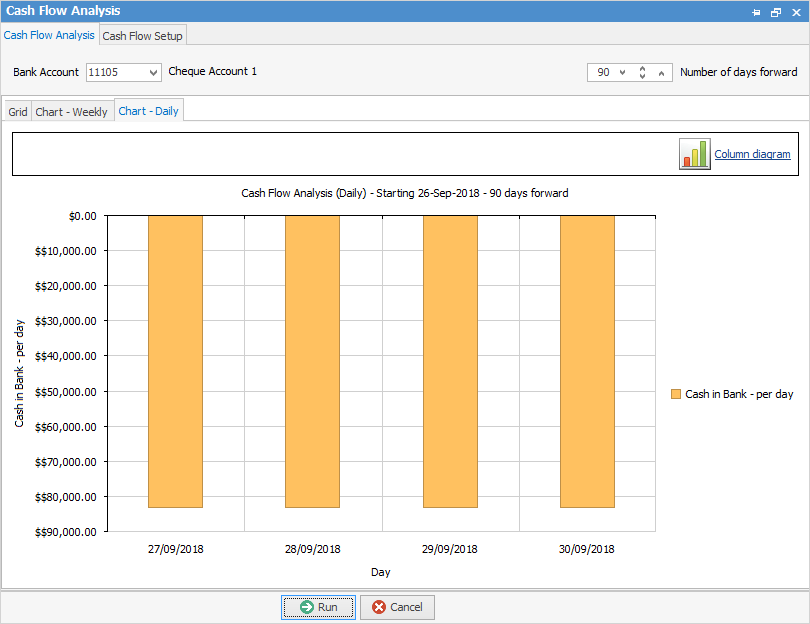
Clicking on the Chart – Weekly or Chart – Daily tabs display a graphic view allowing you to easily spot any potential problems.
The image below shows the Column diagram in use. You can of course use one of the other diagrams instead.
To do this, click the  icon, and choose from Area, Bar, Column, Line, Pie, Stacked Area, Stacked Bars or Stacked Columns.

Further information: