The purpose of a Balance Sheet is to report on the financial position of a company at a certain point in time.
 |
Note: These reports include GST. |
 |
Note: The balance sheet does not include POs on received, the balance sheet is not likely to match stock on hand. You can try running a Stock Valuation by COGS or by Account, under Management > Reports > Stock Report. You can then filter: Real is Finished PO's only, Estimated includes PO's on received using an estimated value. |
In Jim2 financial reporting, a branch only impacts on profit and loss accounts. When branches are used in transactions involving only balance sheet accounts (eg. bank, petty cash, credit card, stock on hand accounts), the branch is only used for list filtering – not for profit and loss reports.
Hence, Jim2 does not have filtering by branch on the Balance Sheet and Trial Balance Reports.

It is divided into two main parts: what the company owns (assets) and what the company owes (liabilities and net worth).

As a Balance Sheet is a snapshot and shows actual figures, it is not possible to have a date range (which indicates difference between figures). In Dates choose a date as of, or select the  icon for predefined dates.

Style: Like the P&L Report, choose how to view the Balance Sheet:
▪Standard – Straight column of totals.

▪YTD Comparison – This will provide a running total of how the company has been performing from the start of the financial year.

▪Previous Year Comparison – Compare performance this time last year with right now.

▪Budget Comparison – This will compare how current performance to a designated budget. Choose a budget from the dropdown options to compare to for this to work.

▪Budget Only – Through this, look at just the budget only.

▪Budget and YTD Comparison – Compares budget and year-to-date side by side.

Like the P&L, choose general ledger levels, offsets, include 13th period, zero balances, account numbers, cents. After selecting all this, Run the Balance Sheet.
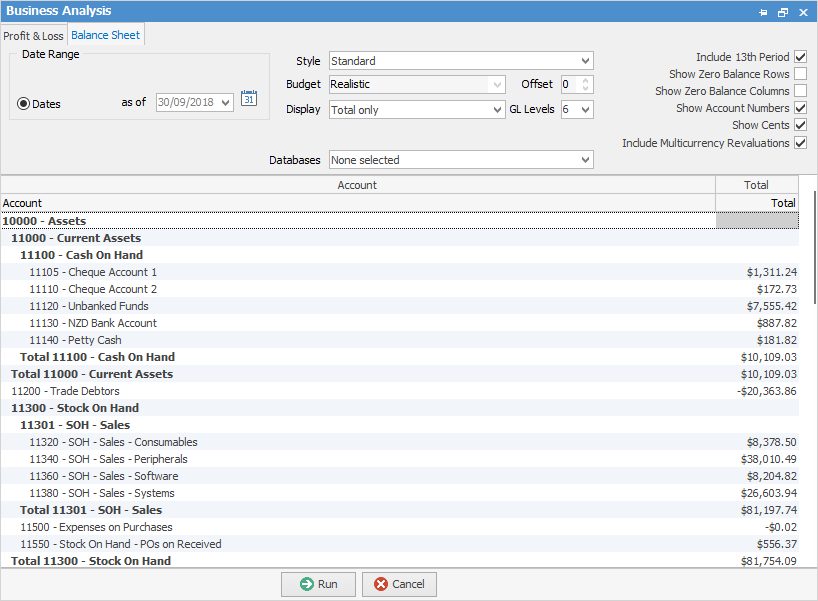
This is a standard Balance Sheet displaying totals only:

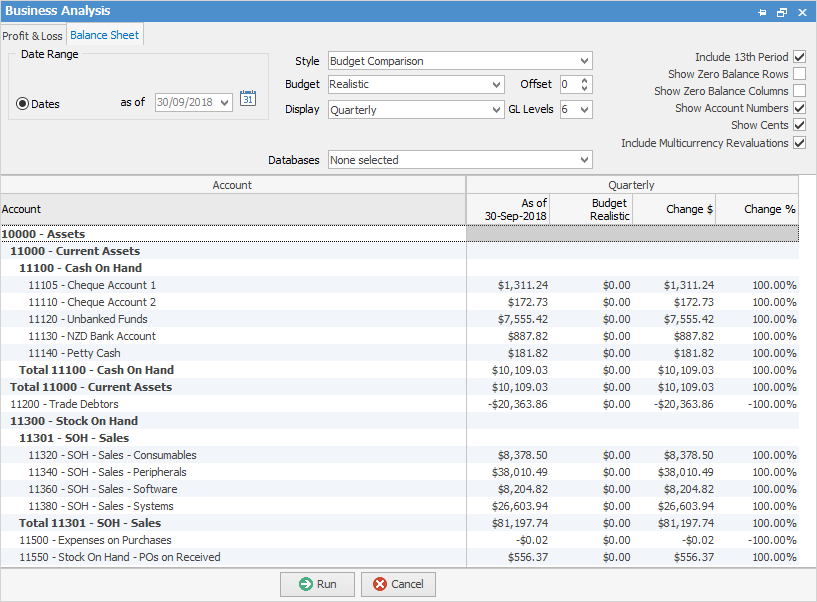
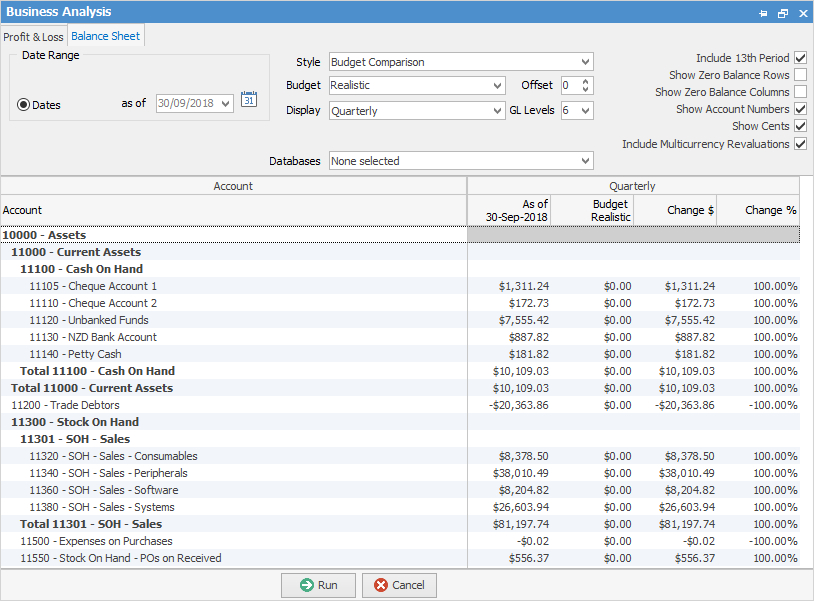
Here is another as a budget comparison, displaying quarterly:

When running a budget comparison Jim2 will display a change in $ and a change in % columns.

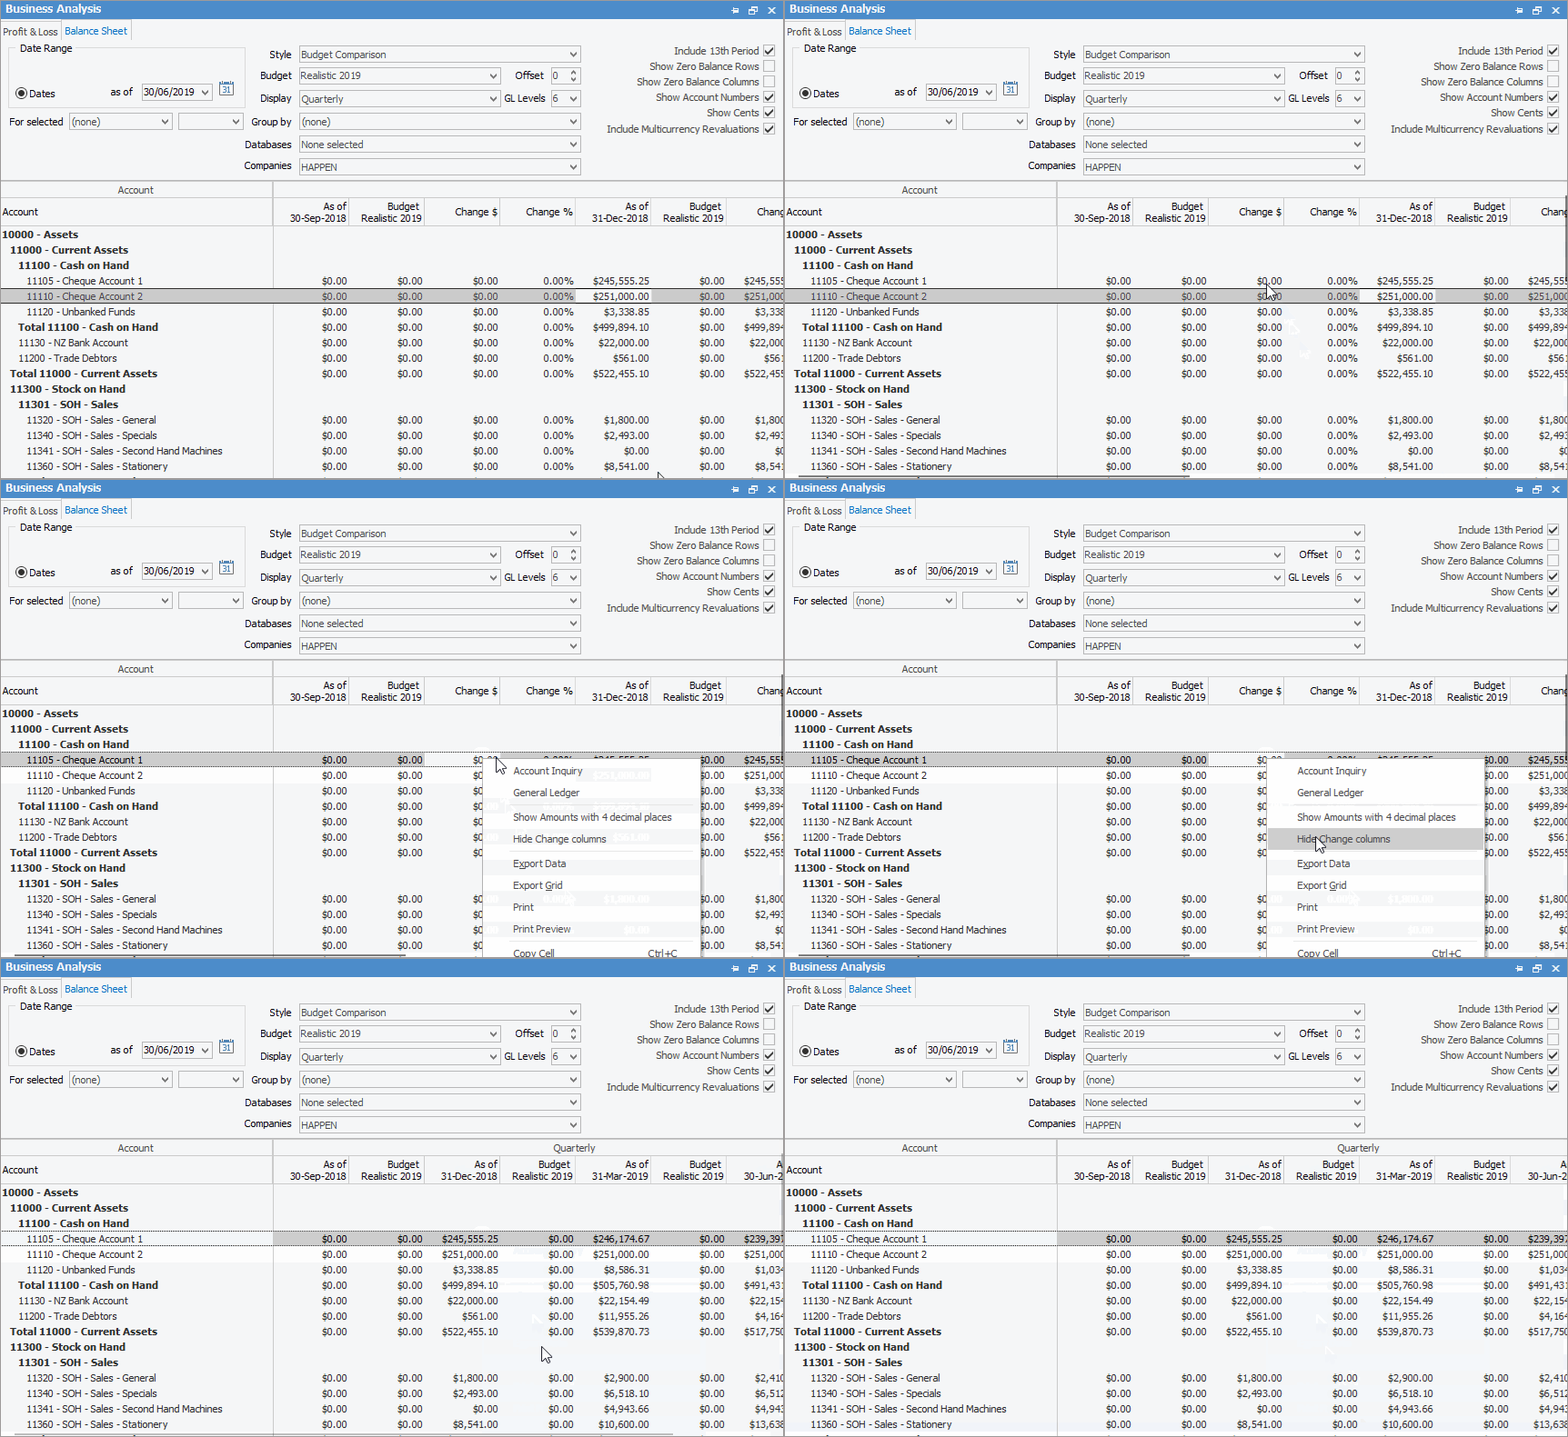
By right clicking on the figures select to Hide the Change Columns, do a drilldown via Account inquiry or General Ledger to see what transactions make up these figures. The option to Export Data to a spreadsheet, HTML, XML or text file is also available.
To generate a backdated Balance Sheet report, enter an as at date. For Balance Sheet reports on the ribbon, go to Management > Business Analysis. This will show the stock values in the various GL Groups at that time.
Further information