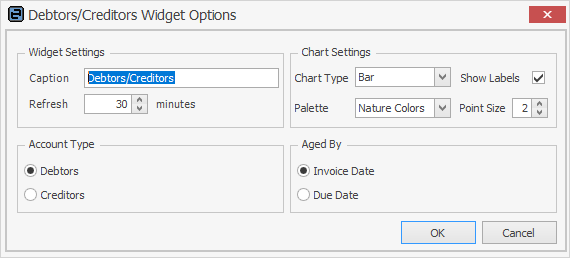
The Debtors/Creditors widget allows viewing the current state of either debtors or creditors as a graph (bar layout only). Debtors/creditors are grouped by Current, 30, 60 and 90+ days. The sum of debtors/creditors is displayed along with the number and total of overdue invoices, follow-ups, unallocated credits and accounts on hold or over limit.
The amounts outstanding can be drilled down on, eg. select the 90 Days bar and a grid will appear listing the overdue invoices. Right click to view that debtor or creditor within Jim2.


Group |
Option |
Description |
|---|---|---|
Widget Settings |
Caption |
This is the caption that will be displayed at the top of the widget. Example: Debtors. |
Refresh |
The widget's refresh interval in minutes. It is suggested not to set this too low, eg. set to 15 minutes or higher. |
|
Chart Settings |
Chart Type |
Only the Bar chart type is available in this widget. |
Show Labels |
Show description and value above each point of the chart. If not ticked, the label will be displayed as a hint when hovering over a graph point. |
|
Palette |
Select the colour palette that will be used in the graph. |
|
Point Size |
The size of graph's points. Default = 2. Try 8 or 10 on smaller graphs.
2 points: 
10 points: 
Bar type charts do not have graph points. |
|
Account Type |
Debtors |
Displays debtors information. |
Creditors |
Displays creditors information. |
|
Aged By |
Invoice Date |
Aged by invoice date. |
Due Date |
Aged by due date. |
There may be a further area below this for Company if you are using Multi-Company.
Further information