
On the profit & loss tab you can run an extremely powerful P&L analysis based on the following query criteria. Let's examine each of them in detail:
Date Range:
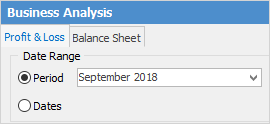
Period
or
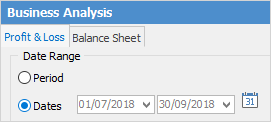
Dates
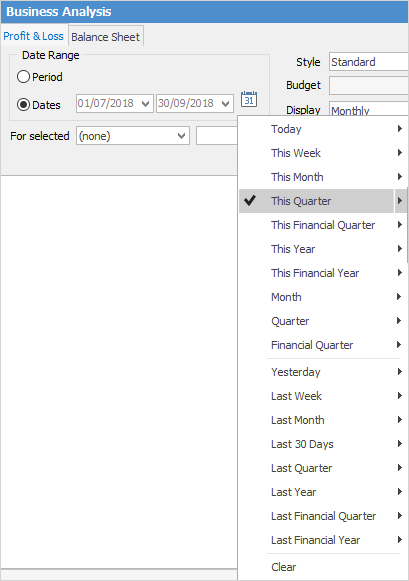
You can choose either to run your P&L report views by accounting periods, or in a specific date range. You can also select the  to choose from a selection of predefined date ranges, such as Today, This Week, This Month, Last Year, Last Quarter, etc.
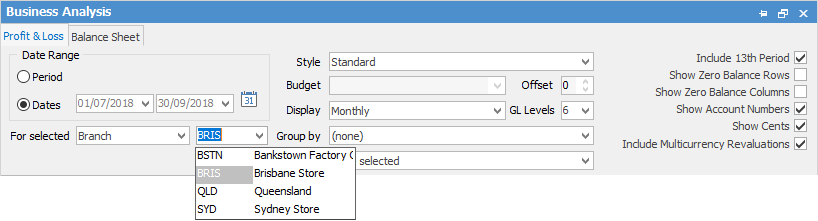
You can choose to run the P&L just for a specific branch (and sub-branch if desired).
In Style you can pick what sort of P&L you would like to look at:
▪Standard – monthly views.
▪YTD Comparison – will give you a running total of how you have been going from the start of the financial year.
▪Previous Year Comparison – You can compare how you went this time last year with how you are going right now.
▪Budget Comparison – This will compare how you are going now to a designated budget. (You have to select a budget from the drop-down options to compare to for this to work!)
▪Budget Only – Through this you can look at budget/projected P&L.
▪Budget and YTD Comparison – Compares budget and year to date side by side.

▪Display – Specify what time period you want the P&L sorted by: Total Only, Daily, Yearly, Monthly, Quarterly, Yearly, Yearly (Financial).
▪Group By – If you have set up Branches or Subbranches, you will have the option to group your P&L by them. Options are: Branch, SubBranch, GL Department, Database.
▪Offset - You can offset your comparisons by year from 9 to -9.
▪GL Levels – Set how many levels down that you want the P&L to look at.
▪Include 13th Period – Include 13th period in your GL.
▪Show Account Numbers/Show Zero Balances/Show Cents – Yes/No?
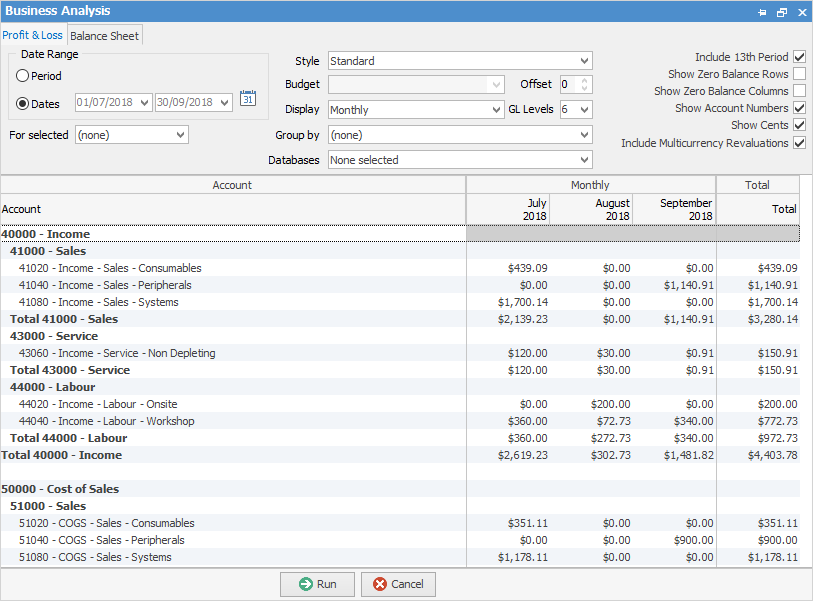
After you have set up these options, you can Run the P&L. This is a standard P&L Report displaying monthly:
And this is a P&L using Budget Comparison showing Quarterly.
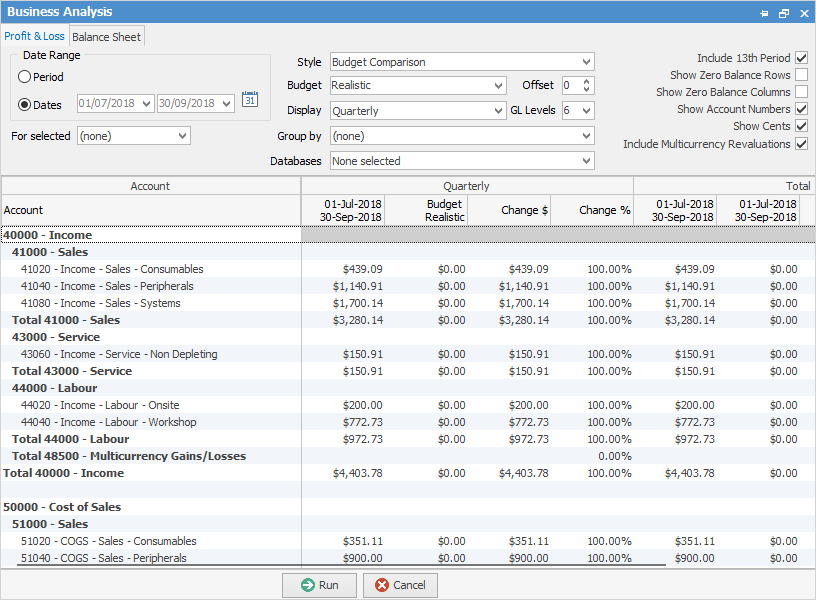
When running a budget comparison, Jim2 will display a change in $ and a change in % columns.
By right clicking on the figures you can choose to Hide the Change Columns, do a drill down via Account Inquiry or General Ledger to see what transactions make up these figures. You can also choose to Export Data to a spreadsheet, HTML, XML or text file.
Further information: