
The purpose of a balance sheet is to report on the financial position of a company at a certain point in time.
It is divided into two main parts: what the company owns (assets) and what the company owes (liabilities and net worth).
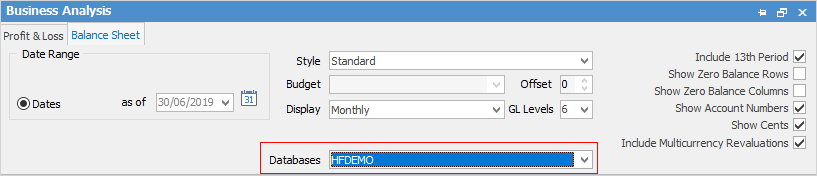
As a balance sheet is a snapshot and showing actual figures, you cannot have a date range (which indicates difference between figures). In Dates choose a date as of, or click the  icon for predefined dates.
Style: Like the P&L Report you can select how you would like to view your balance sheet:
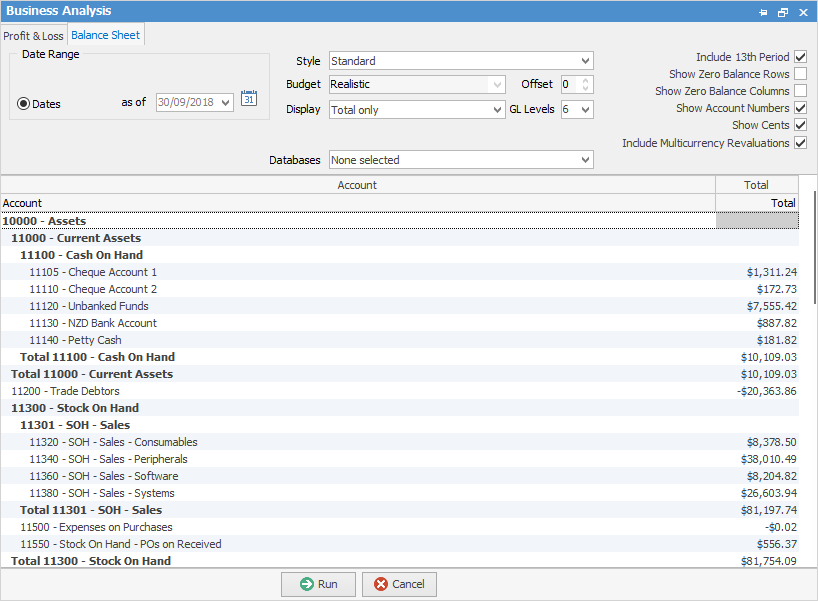
▪Standard – Straight column of totals.
▪YTD Comparison - This will give you a running total of how you have been going from the start of the financial year.
▪Previous Year Comparison – You can compare how you went this time last year with how you are going right now.
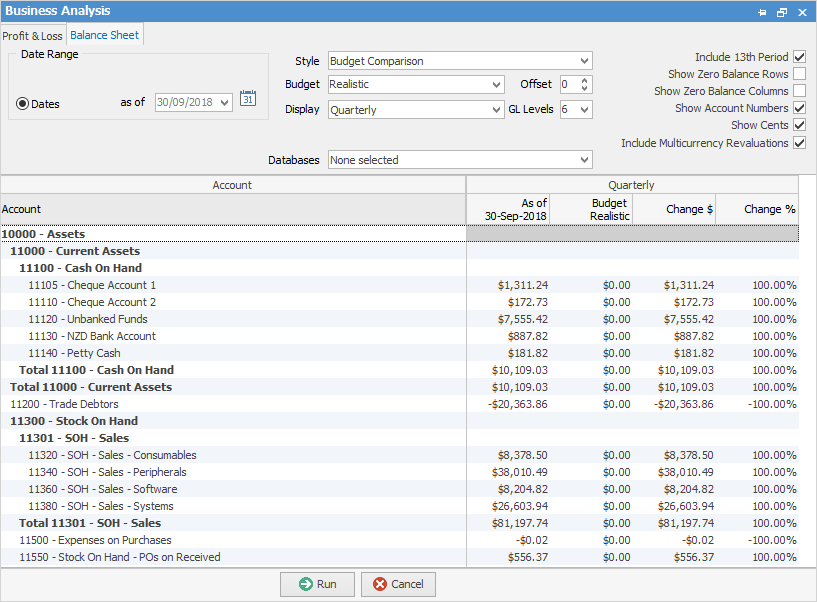
▪Budget Comparison – This will compare how you are going now to a designated budget. You have to select a budget from the drop-down options to compare to for this to work.
▪Budget Only – Through this, you can look at just the budget only.
▪Budget and YTD Comparison – Compares budget and year-to-date side by side.
Like the P&L, you can choose your GL levels, offsets, include 13th period, zero balances, account numbers, cents. After you select all this you then Run your balance sheet.
This is a standard balance sheet displaying totals only:
Here is another as a budget comparison, displaying quarterly:
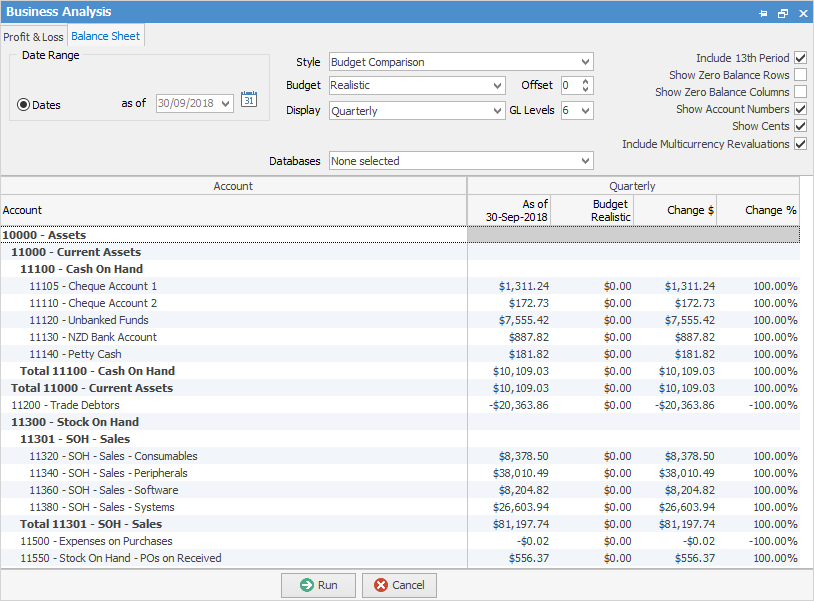
When running a budget comparison Jim2 will display a change in $ and a change in % columns.
By right clicking on the figures you can choose to Hide the Change Columns, do a drill down via Account Inquiry or General Ledger to see what transactions make up these figures. You can also choose to Export Data to a spreadsheet, HTML, XML or text file.
You can generate a back dated balance sheet report (enter an as at date). For balance sheet report on the ribbon, go to Management > Business Analysis. This will show the stock values in the various GL groups at that time.
Further information: