
The Account Watch widget allows viewing of all areas of the company's financial information. It can be configured to display any account within the general ledger, including headers and computed accounts such as gross profit, net profit and operating profit for a specific period. It can also be configured to display information relating to branch (if branches are enabled), sub-branch or GL department.
Periods include days, weeks, months, quarters, years. The widget will display results which can be compared to the same/different account over the same/previous period.
An extremely powerful feature of the Account Watch widget is the MAT function. MAT stands for Moving Average Total. When looking at a year of information, this is also known as Moving Annual Total.
Moving average is a technique to obtain an overall idea of the trends in a dataset. It is an average of any subset of numbers. The moving average is extremely useful for forecasting long-term trends. It can be calculated for any period of time. For example, having sales data for a twenty-year period, it is possible to calculate a five-year moving average, a four-year moving average, a three-year moving average, etc.
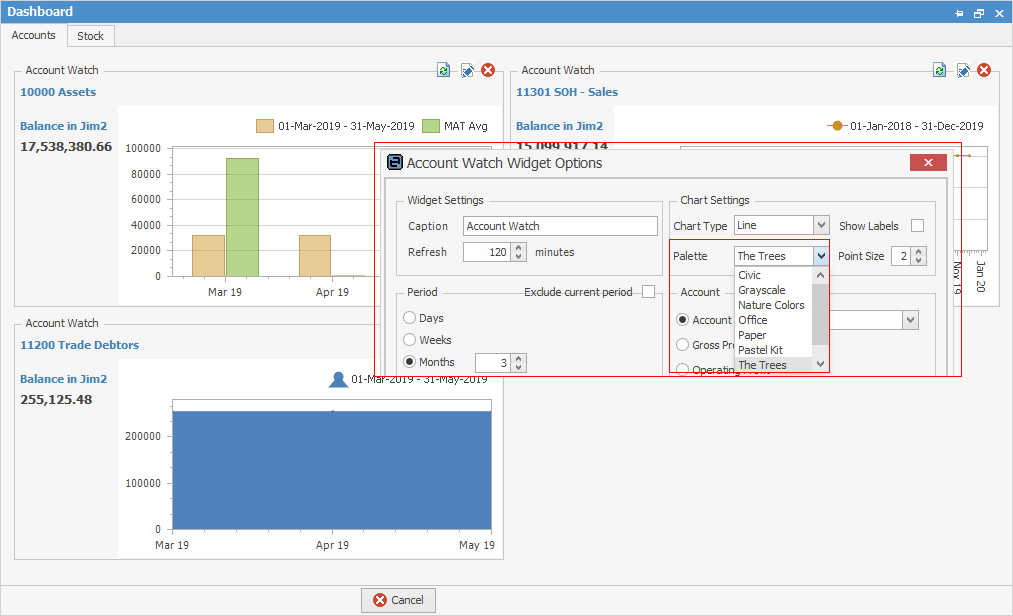
Click Configure to open the Account Watch Widget Options screen, where what should be seen can be defined.
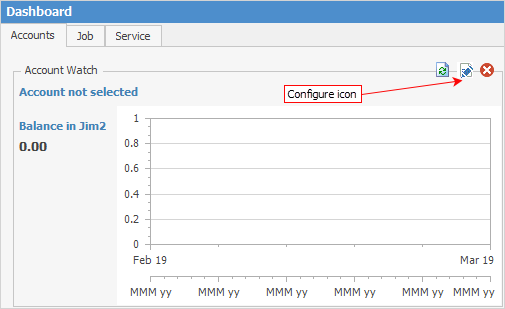
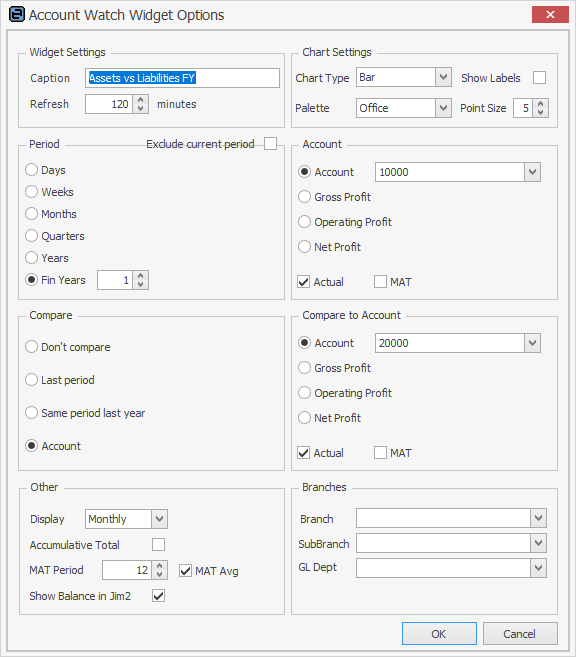
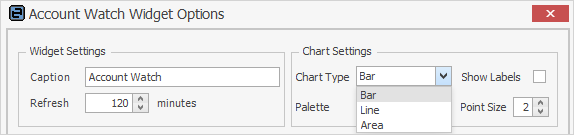
Chart types are Bar, Line and Area
 |
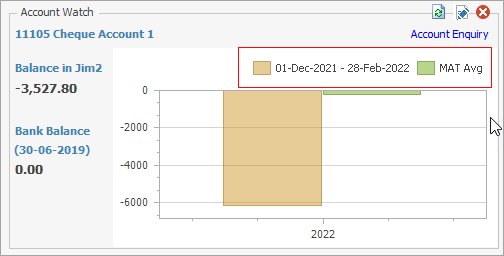
At the top of the widget, you will see the legend, which explains what the colours in the graph represent. In this example, they mustard colour is Actual and the green colour is the MAT.
 |
Fields in the Account Watch Widget
Group |
Option |
Description |
|---|---|---|
Widget Settings |
Caption |
This is the caption that will be displayed at the top of the widget. Example: Assets vs Liabilities FY (financial year). |
Refresh |
The widget's refresh interval in minutes. It is suggested not to set this too low, eg. set to 15 minutes or higher. |
|
Chart Settings |
Chart Type |
Choose from:
Bar 
Line 
Area  |
Show Labels |
Shows description and value above each point of the chart. If not ticked, the label will be displayed as a hint when hovering over a graph point. |
|
Palette |
Select the colour palette that will be used in the graph. |
|
Point Size |
The size of the graph's points. Default = 2. Try 8 or 10 on smaller graphs.
2 points: 
10 points:  |
|
Period |
Days |
Default is 365. Use up/down arrows to change number of days. |
Weeks |
Default is 1. Use up/down arrows to change number of weeks. |
|
Months |
Default is 3. Use up/down arrows to change months. |
|
Quarters |
Default is 1. Use up/down arrows to change quarters. |
|
Years |
Default is 1. Use up/down arrows to change calendar years. |
|
Fin Years |
Default is 1. Use up/down arrows to change financial years. |
|
Exclude current period |
Tick to exclude the current period from any results for a chosen period, eg. if Months is set to 1 and this box is not ticked, the current month will be shown. If it is ticked, the previous month will be shown. |
|
Account |
Account |
Display the selected general ledger account as the graph's first series of data. |
Gross Profit |
Display gross profit as the graph's first series of data. |
|
Operating Profit |
Display operating profit as the graph's first series of data. |
|
Net Profit |
Display net profit as the graph's first series of data. |
|
Actual |
Tick to display the actual (real) account figures. |
|
MAT |
Tick to display the MAT (using MAT options below) account figures. |
|
Compare |
Don't Compare |
Display only the graph's first series of data. |
Last Period |
Compare to data from last period. Example: If Period = This Month, comparison = Last Month. |
|
Same Period Last Year |
Compare to data from same period last year. |
|
Account |
Compare to data from a different general ledger account. |
|
Compare to Account |
Account |
Compare against the selected general ledger account, or leave blank to compare against the same account. |
Gross Profit |
Compare against gross profit. |
|
Operating Profit |
Compare against operating profit. |
|
Net Profit |
Compare against net profit. |
|
Actual |
Tick to display the actual (real) account figures in the comparison. |
|
MAT |
Tick to display the MAT (using MAT options below) account figures in the comparison. |
|
Other |
Display |
Group and display data by selection: daily, weekly, monthly or quarterly. |
Accumulative Total |
Display data as an accumulative total. Example: when displaying a P&L account, the data will start at zero and will be added together for the period selected. |
|
MAT Period |
The number of periods used in MAT calculations. Example: when displayed by months, 3 would be the total of the current month and the previous two months. |
|
MAT Avg |
Display MAT as an average (rather than a total). Example: 50 + 100 + 60 = 210, then 210÷3 = 70 |
|
Show Balance in Jim2 |
Displays the balance of the selected account or the gross profit, operating profit or net profit (whichever of these has been selected in account options). |
|
Branches*
|
Branch (if branches are enabled) |
Filter P&L account data by a specific branch. |
Sub-Branch |
Filter P&L account data by a specific sub-branch. |
|
GL Dept |
Filter P&L account data by a specific GL Department. |
*Under Branches, a Company field will display if using Multi-Company.
What to look at
Multiple Account Watch widgets can be added to see the entire financial position of the company, along with trends. It is suggested to configure several dashboard tabs to cover the various financial aspects of the business.
Where is this information coming from?
All data displayed in the Account Watch widget comes directly from the Transaction Journal. Any information within the widget can be compared directly to information displayed within the Profit & Loss and Balance Sheets. Any general ledger account, including headers and computed accounts, such as net profit, can be selected and displayed.
Some suggestions
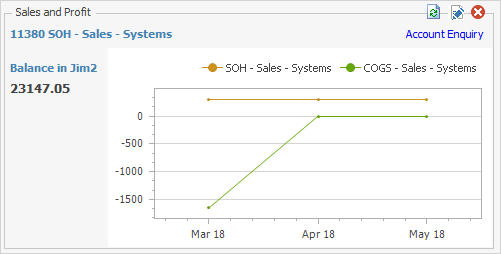
Sales and profit
Try comparing a Stock GL Group's income account vs its COGS account. Or total income (header account 4-0000) vs expenses (header account 6-0000).
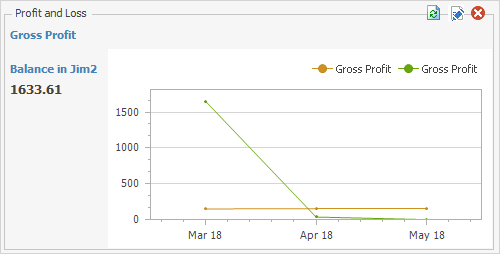
Profit and loss
Compare gross profit vs net profit, or net profit this year compared to last.
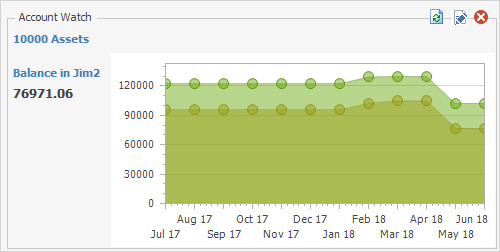
Assets and liabilities
Try viewing the current bank balance or the cash assets (all bank accounts and unbanked funds) over a specific period.
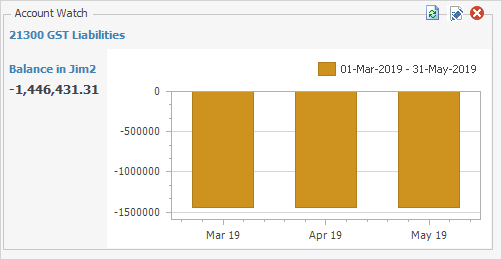
Keep an eye on GST and tax liabilities.
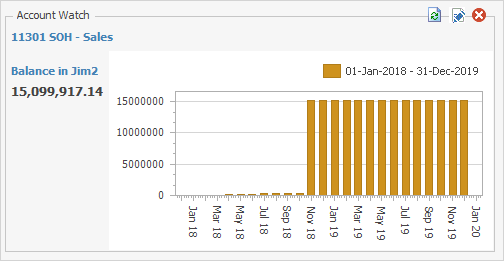
Monitor stock on hand (SOH) figures for this year vs same period last year.
Depending on the type of business, when looking for trends it is normal to look at data over a year. In this case try setting the period to Fin Year = 1 or Days = 365.
The Moving Average Total (MAT) feature is particularly useful here. For example, try displaying a profit account and tick both Actual and MAT. In the Other section of Options, set Display to Monthly, the MAT period to 3 and tick MAT Avg.

The widget will now show a year's worth of data, displayed monthly, along with a three month MAT.
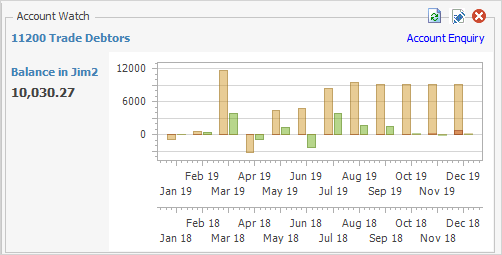
MAT is an extremely powerful method that looks for trends by smoothing out the highs and lows, and displaying a rolling average. This makes it easier to compare performance, especially to previous periods.
Chart types and palettes
Try changing chart types to match the type of data being displayed. Some data looks better when displayed as an area chart rather than a bar chart, or vice versa.
Use palettes to make widgets more distinctive, eg. Office for Profit & Loss, or Nature for Balance Sheet.
Further information