Profit & Loss can only be run on accrual-based reporting.
On the Profit & Loss tab you can run an extremely powerful P&L analysis based on the following query criteria.
 |
Note: These reports include GST. |
Date Range

Period
or
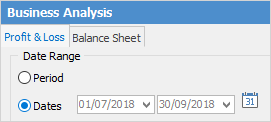
Dates
Choose either to run the P&L report views by accounting periods, or for a specific date range. Click the ![]() to choose from predefined date ranges, such as Today, This Week, This Month, Last Year, Last Quarter, etc.
to choose from predefined date ranges, such as Today, This Week, This Month, Last Year, Last Quarter, etc.
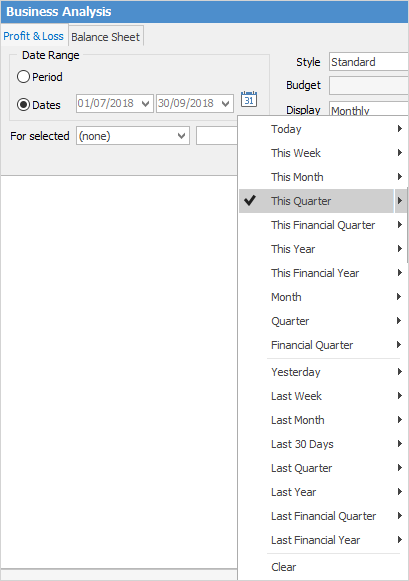
The P&L can be run just for a specific branch, sub-branch or GL department (if branches are enabled), or it can be run on multiple branches, sub-branches and GL departments at once.

In the GL Department drop-down, you can also select (blank) – this allows to specifically show transactions that have an empty GL department.
In Style pick what sort of P&L to look at:
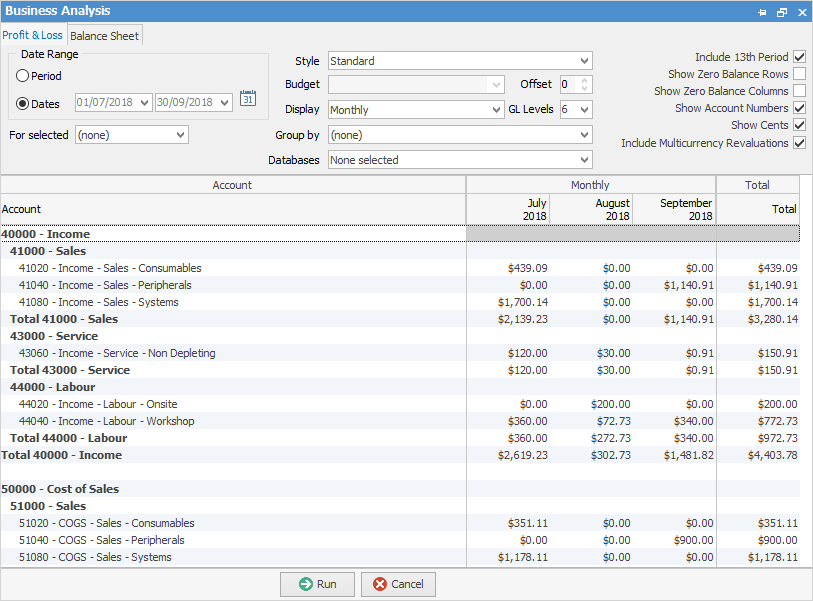
▪Standard – monthly views.

▪YTD Comparison – will provide a running total of how the business has been performing from the start of the financial year.

▪Previous Year Comparison – Compare performance this time last year with right now.

▪Budget Comparison – This will compare performance now with a designated budget. Choose a budget from the drop down options to compare to for this to work.

▪Budget Only – Through this look at budget/projected P&L.
▪Budget and YTD Comparison – Compares budget and year to date side by side.
▪Display – Specify what time period the P&L is to be sorted by: Total Only, Daily, Yearly, Monthly, Quarterly, Yearly, Yearly (Financial).
▪Group By – If Branches or Sub-Branches are enabled, there is an option to group the P&L by them. Options are: Branch, Sub-Branch, GL Department, Database.
▪Offset – Offset comparisons by year from 9 to -9.
▪General Ledger Levels – Set how many levels down the P&L is to look at.
▪Include 13th Period – Include 13th period in the general ledger.
▪Show Account Numbers/Show Zero Balances/Show Cents – Yes/No?
After these options have been set up, run the P&L. This is a standard P&L Report displaying monthly:
And this is a P&L using Budget Comparison showing Quarterly.
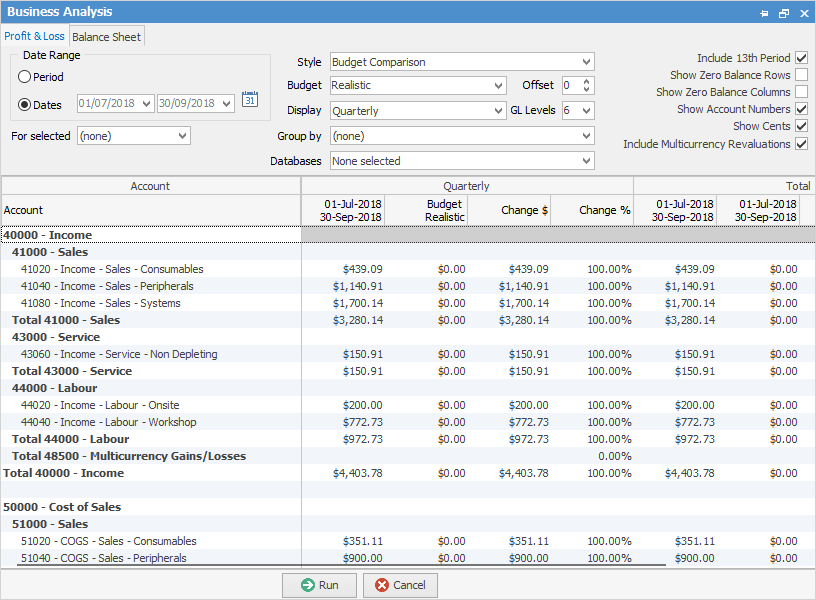
When running a budget comparison, Jim2 will display a change in $ and a change in % columns.
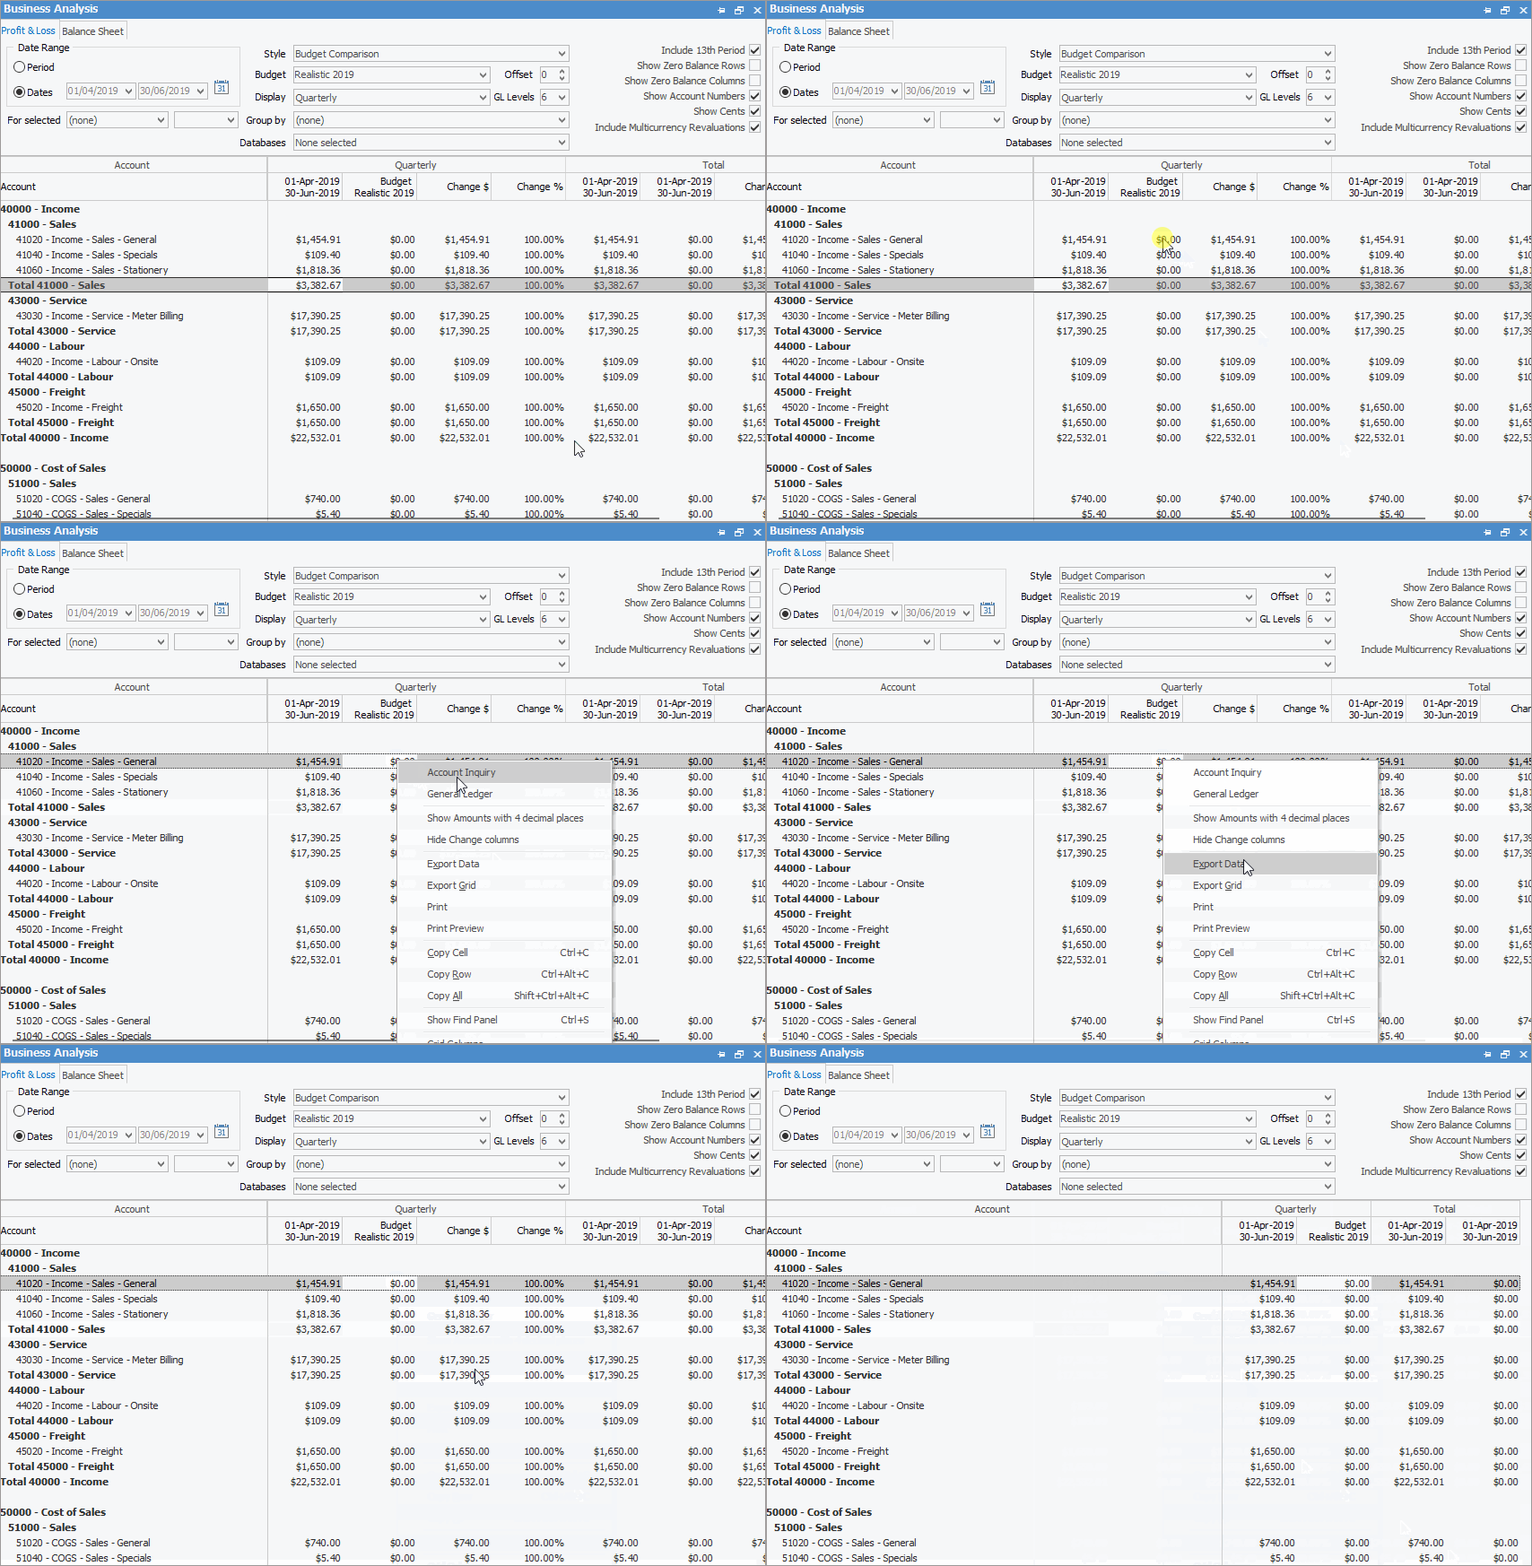
By right clicking on the figures select Hide the Change Columns, do a drilldown via Account inquiry or General Ledger to see what transactions make up these figures. There is also an option to Export Data to a spreadsheet, HTML, XML or text file.
There are two right click options in the grid. Clicking on certain fields will show:
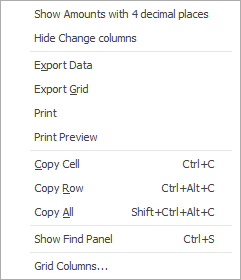
Right Click Option |
Explanation |
||
|---|---|---|---|
Show Amounts with 4 decimal places |
Click to show any amounts with 4 decimal places. |
||
Export Data |
Export data from the grid (based on grid columns added) to a spreadsheet with only one header row. |
||
Export Grid |
Exports the grid (based on grid columns added) to a spreadsheet. This is particularly useful if the grid has more than one header row, as it will export all header rows. |
||
Print the list. |
|||
Print Preview |
Preview the list to be printed. |
||
Copy Cell |
Copy the highlighted cell. |
||
Copy Row |
Copy the highlighted row. |
||
Copy All |
Copy all, which can then be pasted into a spreadsheet. |
||
Show Find panel |
Brings up the Find panel:

|
||
Grid Columns... |
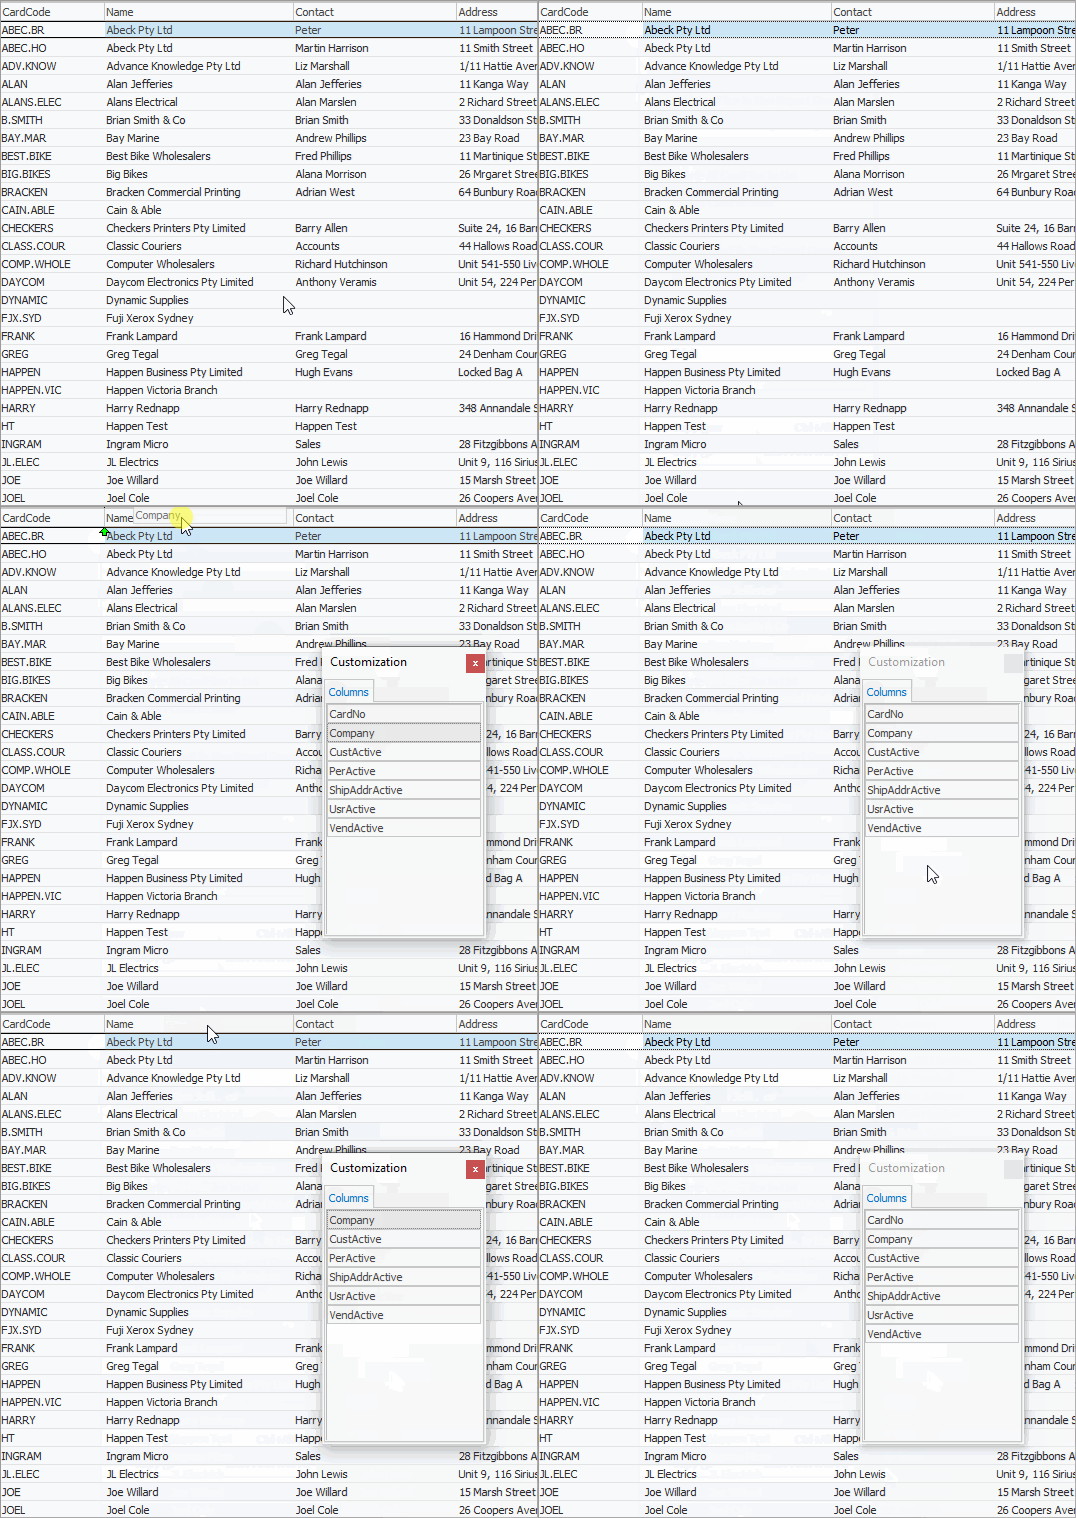
Allows adding more columns. Also allows removal of columns. Select the column to add, then drag it to the position required in the columns within the grid. To remove, click and drag to the Grid Columns... window, or drag down away from the header area.
 |
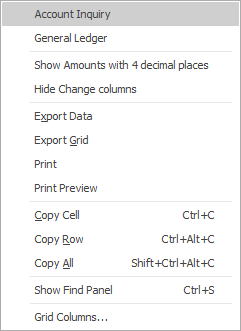
Clicking on empty fields will show:
Right Click Option |
Explanation |
|---|---|
Account Inquiry |
Selecting this will bring up the Account Inquiry screen, however you will receive a warning to select a GL Account. |
General Ledger |
This will open the General Ledger |
Following rows |
As per the table above. |
Further information
