
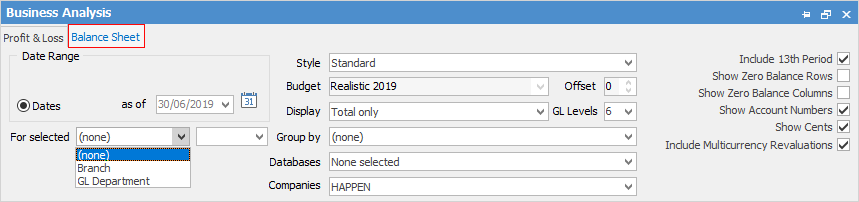
The purpose of a Balance Sheet is to report on the financial position of a company (or companies) at a certain point in time. All companies by branch (if Branches are enabled), sub-branch, GL Department and even databases (the structure of the general ledger must be the same in all databases) can be reported on, or on all or some of the companies by selecting those companies in the Companies field.
It is divided into two main parts: what the company (or companies) owns (assets) and what the company (or companies) owes (liabilities and net worth).
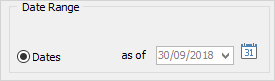
As a Balance Sheet is a snapshot and showing actual figures, a date range is not possible (which indicates difference between figures). In Dates, choose a date as of, or click the  icon to choose other dates.
In Style, select how to view the Balance Sheet:
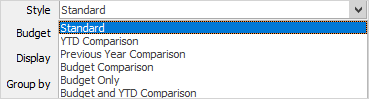
▪Standard – Straight column of totals.
▪YTD Comparison – This will provide a running total of the business has been performing from the start of the financial year.
▪Previous Year Comparison – Compare this time last year with right now.
▪Budget Comparison – This will compare how the business is performing now to a designated budget. Set up budgets in Tools > Setups > Accounting > Budgets, then choose a budget from the dropdown options to compare to for this to work.
▪Budget Only – Through this, look at just the budget only.
▪Budget and YTD Comparison – Compares budget and year-to-date side by side.
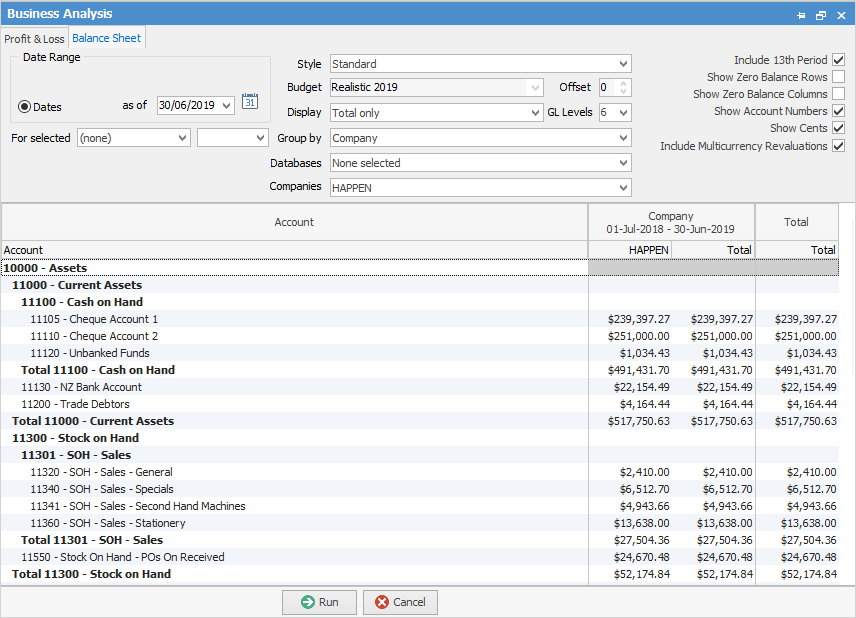
General ledger levels, offsets, include 13th period, zero balances, account numbers, cents can also be chosen. After choosing, click Run to produce the Balance Sheet.
This is a standard Balance Sheet displaying totals only:
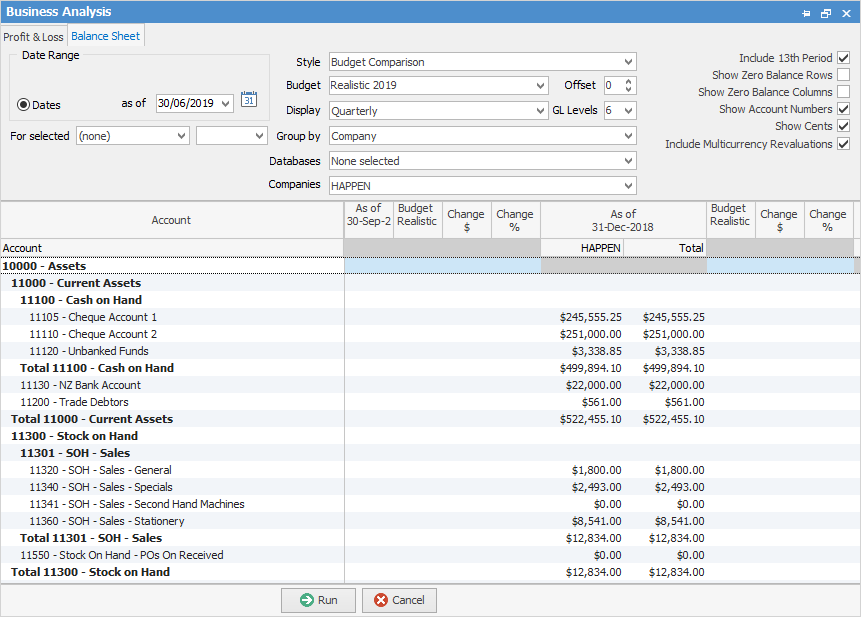
Here is another as a budget comparison, displaying monthly:
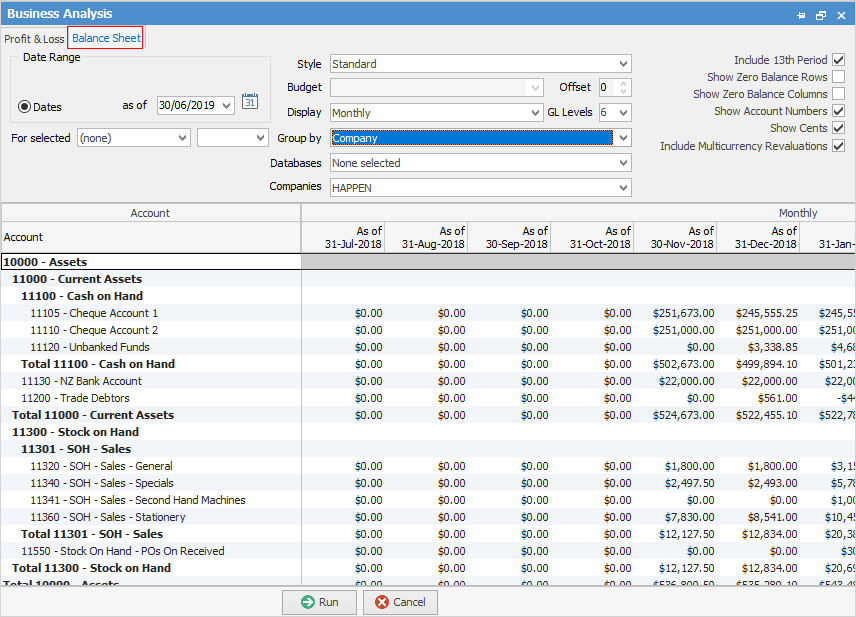
When running a budget comparison Jim2 will display a change in $ and a change in % columns.
By right clicking on the figures, select Hide the Change Columns, do a drilldown via Account inquiry or General Ledger to see what transactions make up these figures. Right click in the grid and select Export Data to export to a spreadsheet, HTML, XML or text file.
A backdated Balance Sheet report can also be generated(enter an as at date). For the Balance Sheet report on the ribbon, go to Management > Business Analysis. This will show the stock values in the various GL Groups at that time.
Further information
CardFiles, Jobs, Quotes, Purchase Orders