Report Designer works in a similar way to many Windows-based applications.
Report Designer provides:
Menu |
Pull down selections with File, Edit, View, Report and Help options. |
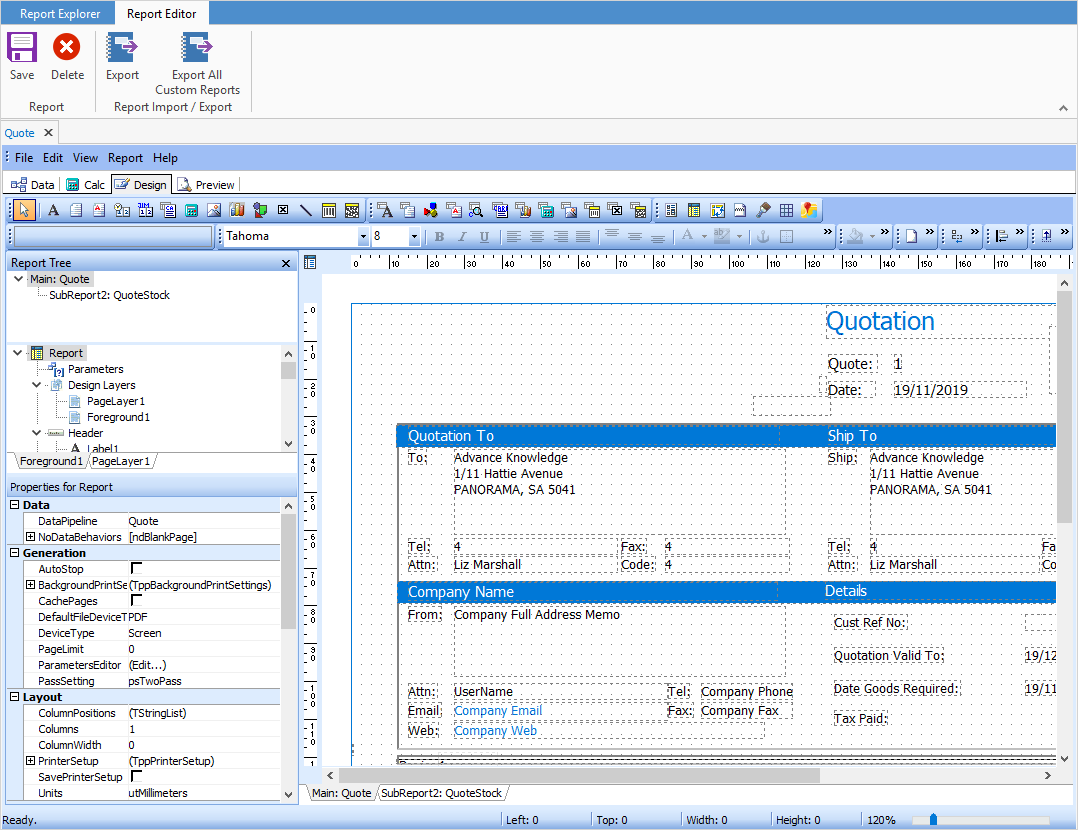
ToolBar |
Contains editing tools and components (objects). |
Tabs |
Shows the Report Data, Calc, Design and Preview screens. |
 |
As Report Designer requires programming skills as well as Microsoft SQL knowledge, the information in this section is limited. For more detailed information regarding Report Designer please refer to www.digital-metaphors.com (copy and paste into a web browser). |
For the purpose of this Help file, familiarity with RAP (Report Application Pascal) is necessary.
 |
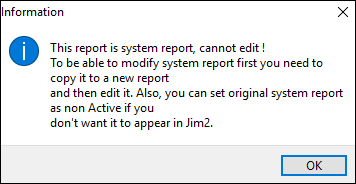
System reports should never be modified – make a copy of the existing system report and make changes to that copy. This ensures that reports don't become broken during upgrades. A warning will pop to screen that system reports cannot be edited.
 |
|
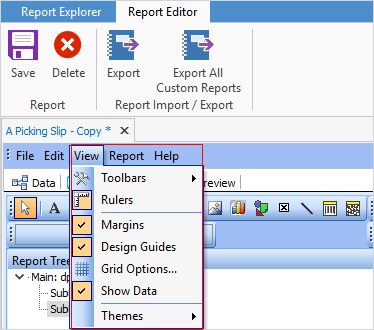
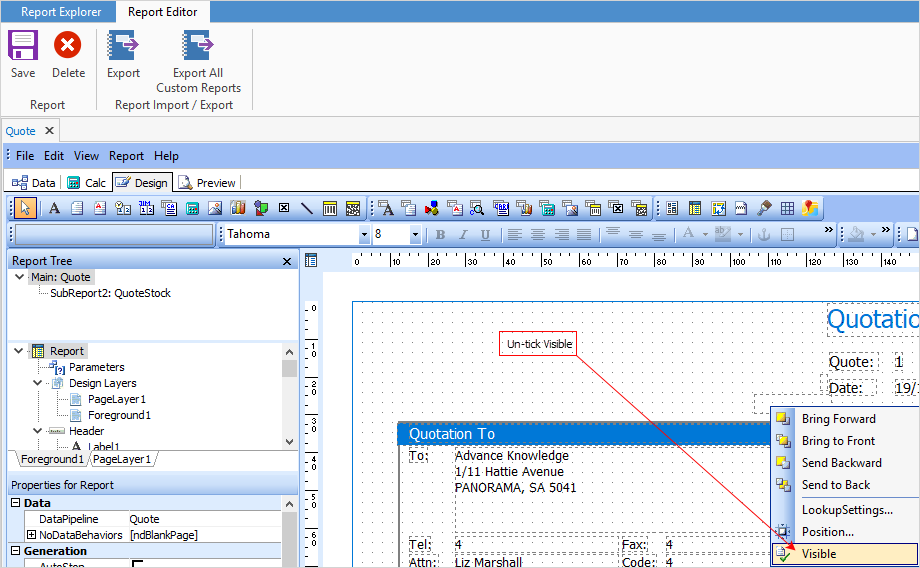
Should any areas disappear, go to the View tab to reinstate them. It is also recommended to not delete things, as this can cause the report to crash. See
 |

Report Designer uses standard edit options (such as cut, copy, paste, bring to front, send to back, etc.), toolbar functions (functions to draw, align, nudge, change size, toolbar rulers, grids, etc.), toolbar objects (components), and report options (page style, portrait, landscape, pixel sizes), drag and drop ability within the report layout, as well as dropping objects or design components into reports.
|
This is where RAP (Report Application Pascal) functions are applied. The RAP code is executed when an event occurs. Each report object or component will fire one or more events. The code itself will be executed when any associated event occurs. |
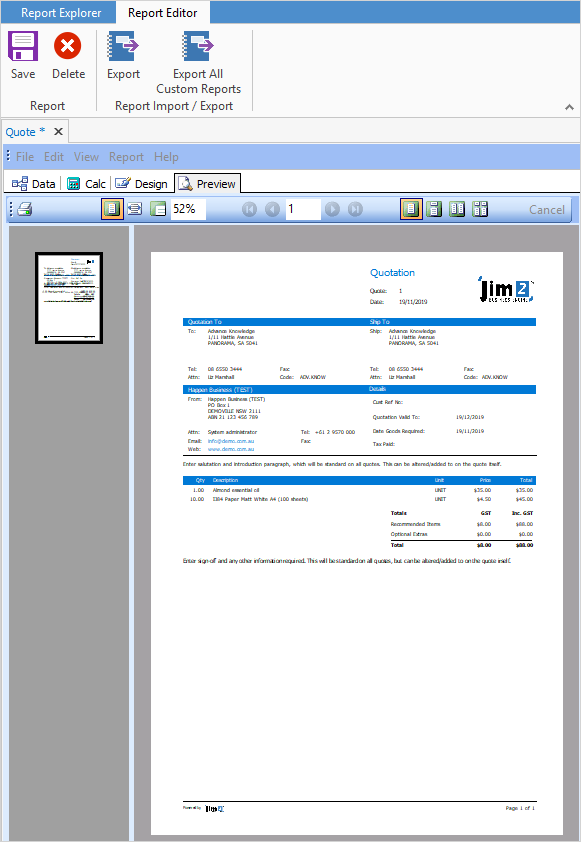
The report being designed can be previewed to see roughly how it will be printed. Scripts will automatically provide dummy data for the RAP, so that a preview will show data results as it appears within the report design layout. When editing a report, choices are to use design data or use live data. Design data will populate with dummy data as just mentioned. Live data will populate from the associated object in Jim2.
|
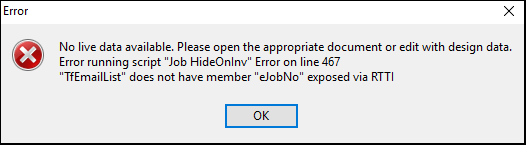
In relation to use within Jim2, the data used for this report is replaced by Jim2 Scripts. This screen will therefore normally be empty. |
Further information
Add a Signable Report for Jim2 Mobile
Display Company Logo in Reports
Set up Back of Page Text on Invoice
For more detailed information regarding Report Designer please refer to www.digital-metaphors.com (copy and paste into a web browser).