|
Jim2 Business Engine continually manages inventory records. The stock valuation reports, based on balance sheet information, can be seen for any date, however, stock on hand quantities cannot be backdated.
|
|
Stock reports are live and as at now which is why the cannot be backdated.
You should regularly run the Stock Value by GL Group (summary) report (located under Management > Reports > Stock Reports) to check that the stock sub ledger and General Ledger values are the same.
|
If a user would like to see a list of stock on hand for a particular date, it is suggested that a backup is restored for that date and the stock on hand reports are then displayed from the restored database.
Please note, producing a stock on hand report in this manner will not necessarily balance with a backdated stock valuation report, as many accounting changes may have occurred between the time of the backup, and the day the stock valuation report is viewed.
You can use the Excel icon to produce reports directly to Excel. Permission for use of this is based on report permissions since it accesses the report for the information.
When Excel is selected, it will open spreadsheet windows and populate it with raw data from the selected report. Each report pipeline with be represented in a separate sheet, eg. Job, JobComments, JobStock etc. This will produce a much more comprehensive report in spreadsheet format for all these reports.
|
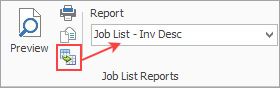
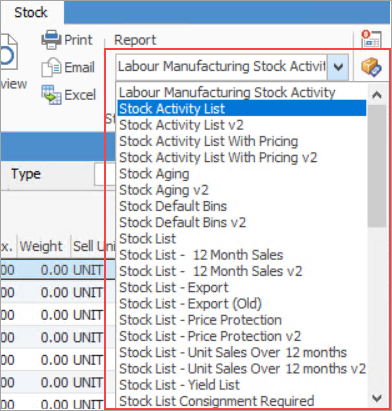
Not all reports are showing here
|
|
|
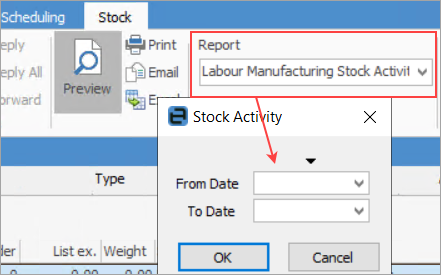
Labour Manufacturing Stock Activity v2
|
You need to filter this report by date.
This report details the quantity and manufacture cost values of Labour type stock codes used in a list of manufacturing jobs within a date range.
The values have been used within the manufacturing process and have been journalled to the nominated labour offset account (Tools > Options >Accounts >Linked Accounts > Manufacturing Labour Costs).
Users may use this report to estimate values for raising general journals to move values from the nominated labour offset account (debit labour offset account, credit xxxxx).
|
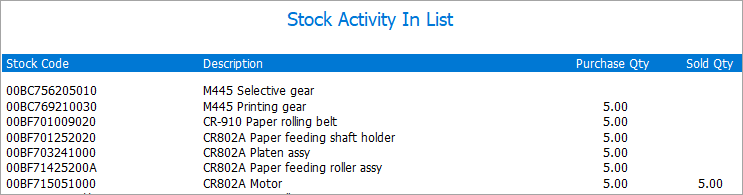
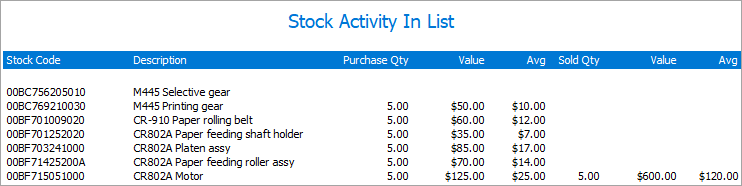
Stock Activity List v2
|
Select dates based on the below criteria and this will produce a list of all active stock in the list for the period chosen.
If you use the Excel icon, you will be presented with full information for the stock codes, including pricing, etc.
|
Stock Activity List With Pricing v2
|
Using the same criteria as above will produce a list of all active stock for the period, including pricing.
|
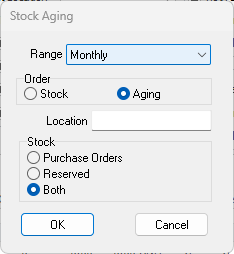
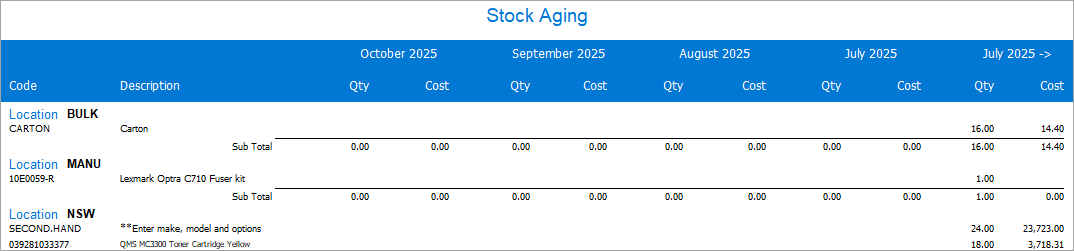
Stock Aging v2
|
This report identifies stock purchased within a specified period that has not yet been sold. This is also useful for identifying slow moving stock or stock that has not moved for a certain period.

|
Note: This report does not include stock that has only been received. Purchase orders must be on finished for the stock to be included.
|
Using the filtering below will produce a list of stock based on the period selected (monthly, quarterly or yearly), showing stock code, description, quantities and cost.
|
Stock Default Bins v2
|
Produces a report showing stock in bins for all locations. This is an Advanced Warehouse Management feature. Lists stock code, description, location, primary and secondary bins.
|
Stock List – 12 Month Sales v2
|
Produces a spreadsheet of all stock codes, description, showing on hand, on order, average COGS and quantity sold in each month.
|
Stock List – Export/Stock List – Export (Old)
|
Produces a spreadsheet of all stock that includes far more information than what can be found in the stock grid. Includes stock code, description List Price, report groups, barcode, measure units, descriptions and quantities, height, width, depth, non report, brand and price groups, short and long descriptions, stock type, price calculation method min sale, min sale price, min sale percent, whether serial is required, tax code on purchase and sel, GL Group, buy and sell unit, Buy/sell stock (true/false) warranty, vendor, price calculation min sale, vendor currency code, commission exclude/include (true/false), floor commission, percent and amount, price template, price level, price tf, percentage, price calculation method, vendor stock code, list price and publish price, floor markup, manufacture part code, alternate stock code, parent stock code and GTI/UPC.
|
Stock List Price Protection v2
|
Once filtered as below, produces a price protection report for the selected vendor, including PO#, PO status, PO type, PO date, invoice#, vendor stock code, stock code, serial number, description, quantity of stock on hand, unit cost and total cost.
|
Stock List – Stock Attribute Default Bins v2
|
For use in Advanced Warehousing. Lists stock code, description, location, stock attributes, bins and quantities.
|
Stock List – Unit Sales Over 12 months v2
|
Select a vendor and location (if applicable), then sort by either Weeks Supply or Supplier.
This will produce a spreadsheet of stock sold monthly over a twelve month period which includes stock code, description, supplier, unit price, quantities on hand, monthly average, number of weeks supply,and value of units on hand.
|
Stock List – Yield List
|
Produces a list showing yield and cover percentage for toners – used for Managed Print Services.
|
Stock List Consignment Required v2
|
Select a stock location and whether to see purchase order numbers.
This will produce a report showing stock code, description and:
▪Consign.In Original Qty
▪Consign.In RTV Qty
▪Consign.In Remaining Qty
▪Consign.In Qty Sold
▪Consign.Buy Qty |
Stock List Kits
|
This will produce a report of all kit contents as at today's date. It will include the kit code, along with the stock and description for each stock, quantity, unit, price and total.
|
Stock List Monthly Sales
|
Whilst this will pre-populate with the last twelve months, you can select a date range and this will produce a spreadsheet of monthly sales by stock code, including description, customer card code and name and brand.
|
Stock List Shelf Talker No Price
|
This will produce A4 sheets (18-up) of shelf talkers, including barcodes.
|
Stock List Shelf Talker PL 1
|
Produces A4 sheets (18-up) of shelf talkers using price level 1.
|
Stock List v2
|
Produces a list of all stock codes, description, sell unit, stock on hand, committed, available, ordered and back ordered.
|
Stock List with GL Groups v2
|
Produces a Stock List including code, description, GL Group and recommended retail price.
|
Stock Movement
|
After selecting a date range in the Advanced List section, select a report group level:
This will produce a comprehensive report on stock movement for the date range entered, including stock code, description, sale quantity and value, purchase quantity and value, RFC and RTV quantity and value and transfers in and out.
|
Stock Movement Adjustments v2
|
After selecting a date range and a report group level (as above), this report will indicate all stock movement up and down for the date range.
|
Stock On Hand v2
|
After selecting appropriate filters, this will produce a full list of stock on hand, including stock code, description, PO#, date, location, unit, quantity, quantity balance, quantity reserved, cost, price and total cost.
Jim2 regards stock as on hand until the job is invoiced.
|
|
Note: You can also view serial numbers via stock list filtered by qty > 0, and serial on buy/sell ticked.
|
The Stock list – Stock on Hand Report includes the below, whereas the Stock Value by GL Account Report does not:
•Consignment Stock (From a Consign In PO)
•Consignment Stock (From a Consign Buy PO), but only if these have not been sold.
|
|
Note: If you require a stock on hand report as at a particular day, go to Management > Reports > Stock Reports and select the Stock Value by GL Group As Of report.
|
|
Stock Prices
|
A price level must be selected to generate this report.
This will produce a stock price list of all stock in the list. It will include the company logo and address details for issuing to customers as a customer price list, along with the stock code, description, unit and price.
|
Stock Prices Compact v2
|
Select a price level along with any other criteria, and this will produce a compact internal price guide as of today's date. It will include stock code, description, price level, unit, price tax free and price including tax.
|
Stock Prices Internal v2
|
Select a price level and any other criteria (the same as above), and this will produce a detailed internal price guide as of today's date. It will include stock code, description, stock type, price level, method, percent, price tax free, price tax included, quantity, %, price tax free and price based on %, average, last and max COGs.
|
Stock References
|
The Stock References report lists stock code, description, stock type, unit and quantity.
|
Stock Stats In List v2
|
Produces a comprehensive list of stock codes, description, on order, manufactured quantity, on hand, reserved, allocated, back ordered and available.
|
Stock Stats In List Value v2
|
Produces a list of stock code, description, on hand, reserved, cost, price and tax.
|
Stock Take (Portrait)(Old)/Stock Take (Old)
|
After selecting the appropriate criteria, this will produce a list of all stock codes, descriptions, locations, allocated, reserved and on hand, along with attributes if ticked.
|
|

|
|
|
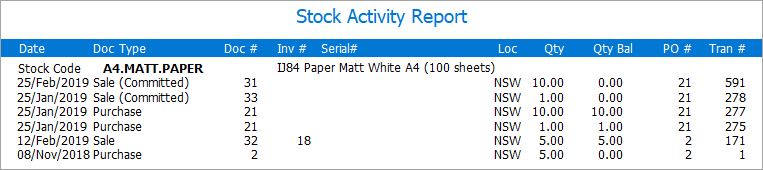
Stock Activity
|
Produces a report listing all sales/purchase activity for the selected stock.
|
Stock Activity No Serial
|
Produces a report listing all sales/purchase activity as above, minus serial numbers.
|
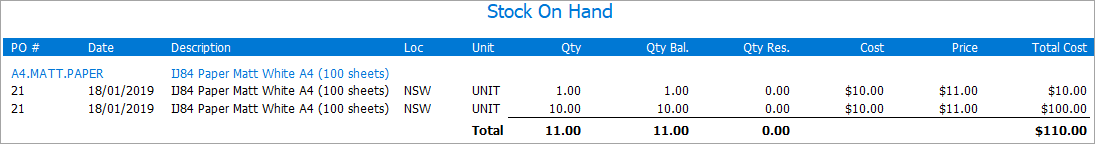
Stock On Hand
|
Produces a detailed report including stock code, description, purchase order number, date, location, unit, quantity, quantity balance, quantity reserved, cost, price and total cost.
|
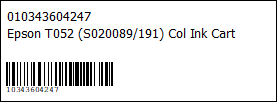
Stock Price Sticker
|
Produces a price sticker for placing on stock. Upon selecting this report, you have the choice of showing List Price or Sell Price:
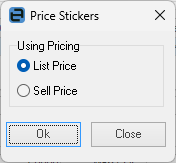
Via Report Designer, you can also choose either price tax free or tax paid.

|
Stock Record
|
Produces a printable copy of the complete stock record.

|
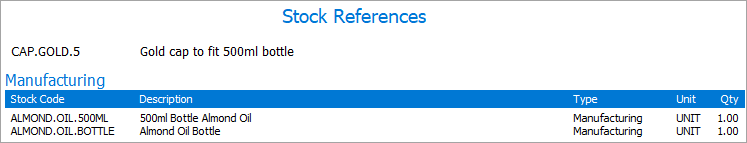
Stock References
|
The Stock References report lists stock type, code, unit and quantity.
|
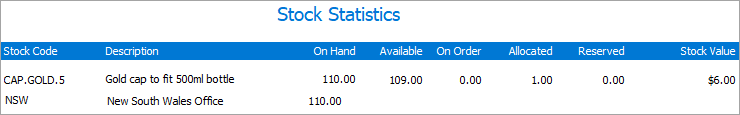
Stock Stats
|
Produces a report detailing stock on hand, available, on order, allocated, reserved and stock value.
|
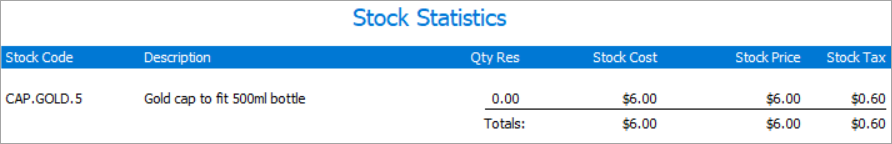
Stock Stats Value
|
Produces a report detailing stock cost, price and tax.
|
|
Further information
Stock List
Stock Preview Pane
Stock Pricing
Stock – Order of Pricing
Tabs in the Footer
Tabs in the Header
Warehouse Management
|